

- FLOKI surges 100% after rebounding from a key trendline, mirroring past setups that triggered multi-fold price rallies since 2022.
- Market watchers expect a possible 5X move as FLOKI repeats a breakout pattern formed after extended consolidation near resistance.
- A descending wedge breakout with growing volume signals FLOKI’s strongest reversal momentum since mid-2022 accumulation began.
FLOKI has staged a strong comeback from its long-term ascending trendline, climbing over 100% in the past few weeks. The price action now mirrors historical breakout patterns that previously led to multi-fold rallies, hinting at a potential retest of former all-time highs.
Breakout Pattern Resurfaces After 18-Month Accumulation
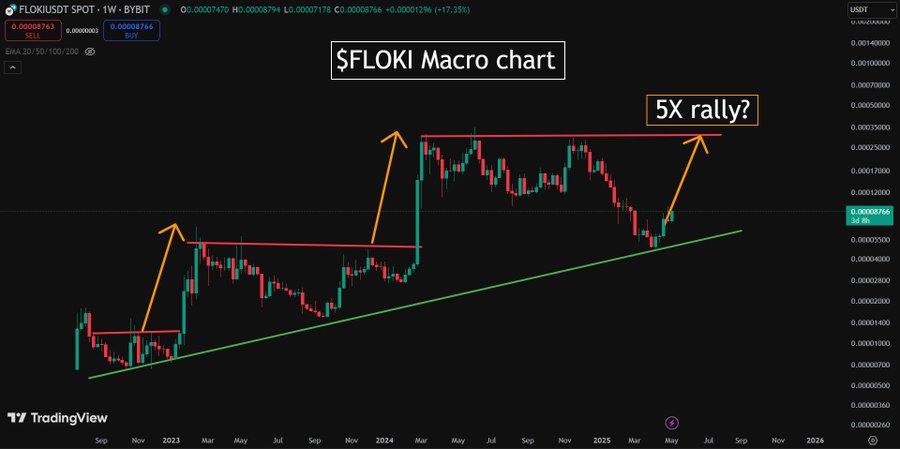
Price history shows FLOKI following a consistent macro structure with alternating phases of consolidation and sharp upside moves. This sequence has repeated twice since late 2022, with a third breakout attempt now underway. Analysts have begun comparing the current movement to the prior rallies for projection insight.
Source: Solberg Invest
FLOKI price recently held support on a long-standing ascending trendline, marking its third major bounce since 2022. Price action then surged more than 100% from local lows, indicating renewed strength. Solberg Invest has provided more insights into this setup based on the weekly chart for FLOKI/USDT.
According to Solberg, FLOKI’s first breakout in early 2023 gained 5X from the 0.00000750 level. He noted that price repeated this rally in early 2024, rising from 0.00000800 to just under 0.00004000. His analysis shows that both rallies began after long consolidations under a horizontal resistance near 0.00003750.
Solberg pointed out that the ascending trendline connecting higher lows since late 2022 has never broken on a weekly close. The current price, now near 0.00002600, is again approaching this resistance zone. Based on the chart’s repeating breakout structure, he believes a 5X target of 0.00020000 is technically plausible.
Descending Wedge Breakout Confirms Long-Term Reversal
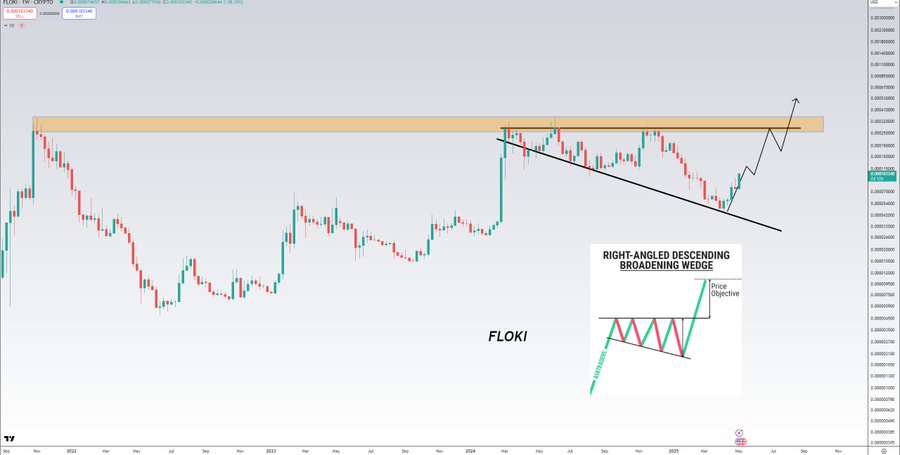
The latest chart formation has drawn attention for its breakout behavior and wedge mechanics, offering a comparative chart structure. Analyst Moustache has presented a broader view of FLOKI’s trend, covering data from mid-2022 through mid-2025. His focus is on the completion of a descending broadening wedge.
Source: Moustache
According to Moustache, FLOKI spent over 18 months inside this wedge, bounded by a horizontal resistance and sloping support. He observed several failed breakouts below the 0.00003500 mark before a decisive move above wedge resistance . His chart also shows that the breakout occurred after the third test of the lower boundary.
Besides identifying the breakout zone, he emphasized increasing weekly candle size as a signal of building momentum. Price now trades near the supply zone that has capped prior rallies since 2022. Moustache expects a retest of wedge resistance before any continuation toward higher levels.


