

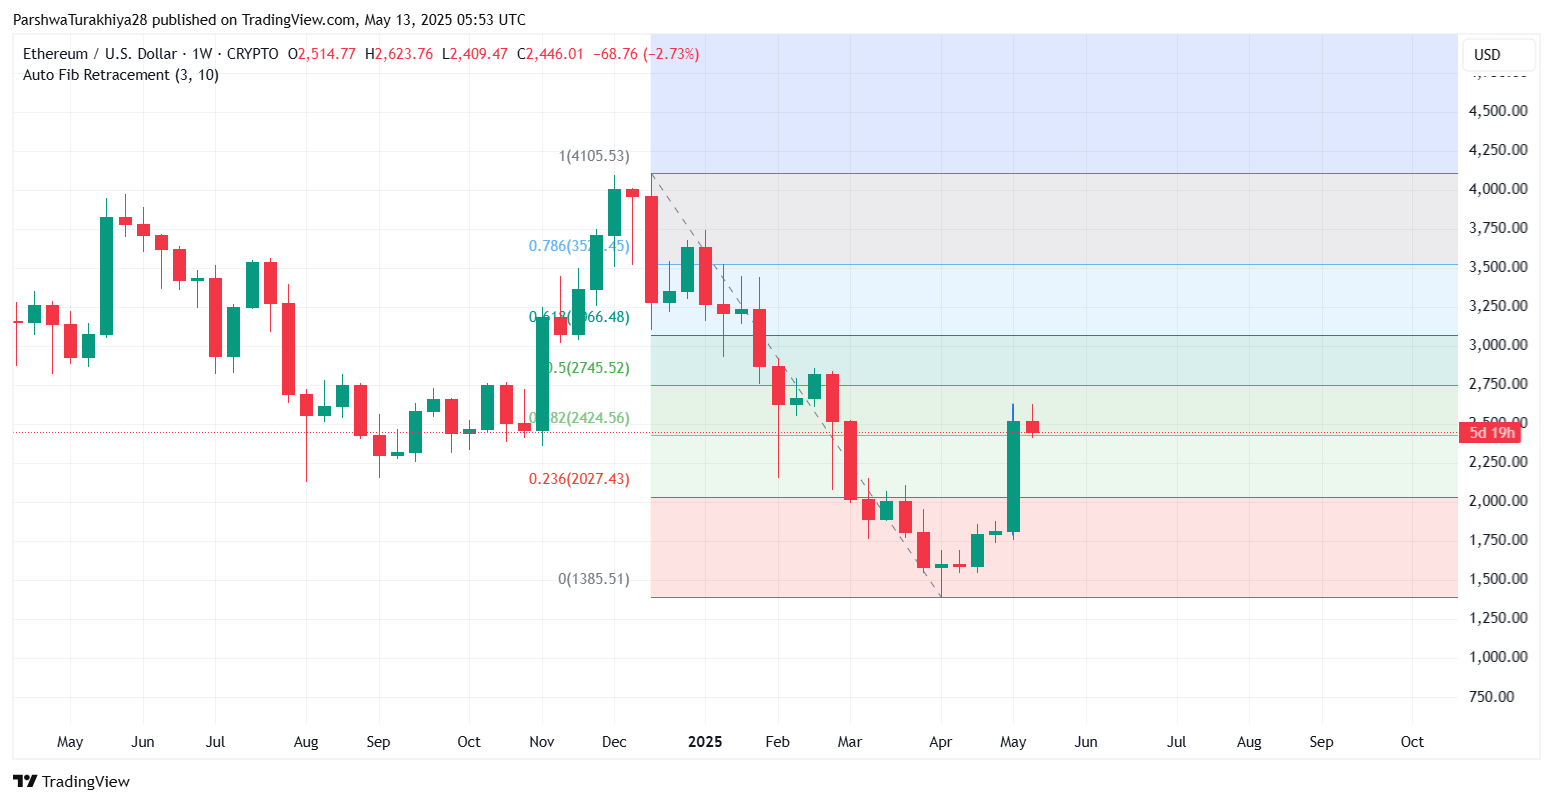
The Ethereum price today is trading around $2,445, following a sharp surge earlier this week that brought ETH to a local high of $2,623. After this bullish breakout, the market is showing signs of consolidation as sellers test the newly formed support around $2,420. This level sits just above the 38.2% Fibonacci retracement ($2,424) on the weekly chart — a zone critical for sustaining upward Ethereum price action.
 ETH/USD price dynamics (Source: TradingView)
From a weekly perspective, Ethereum remains above both the 23.6% and 38.2% retracement levels, signaling a structurally bullish recovery from its March lows near $1,385. However, a decisive move above the 50% zone at $2,745 would be needed to confirm a broader trend reversal.
Ethereum Price Action Faces Pullback in Bullish Flag Formation
 ETH/USD price dynamics (Source: TradingView)
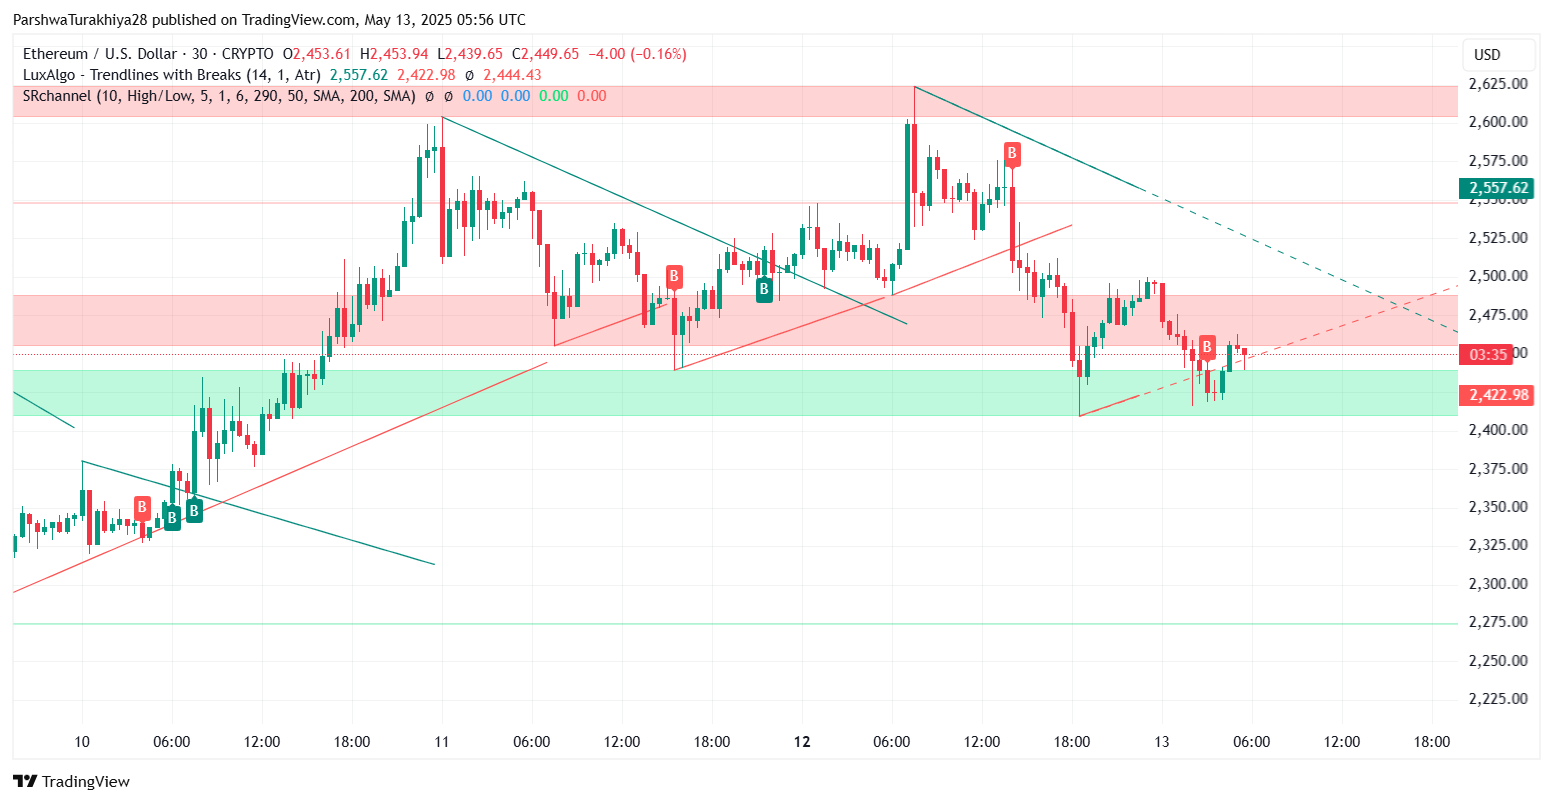
On the 4-hour chart, Ethereum appears to be forming a bullish flag — a continuation pattern, after its strong vertical move from $2,100 to $2,600. Price is currently correcting within a descending channel, trading near the lower bound. If bulls defend the $2,420–$2,430 support cluster (which aligns with EMA20 and lower Bollinger Band), we could see a breakout continuation toward $2,550 and even $2,600.
 ETH/USD price dynamics (Source: TradingView)
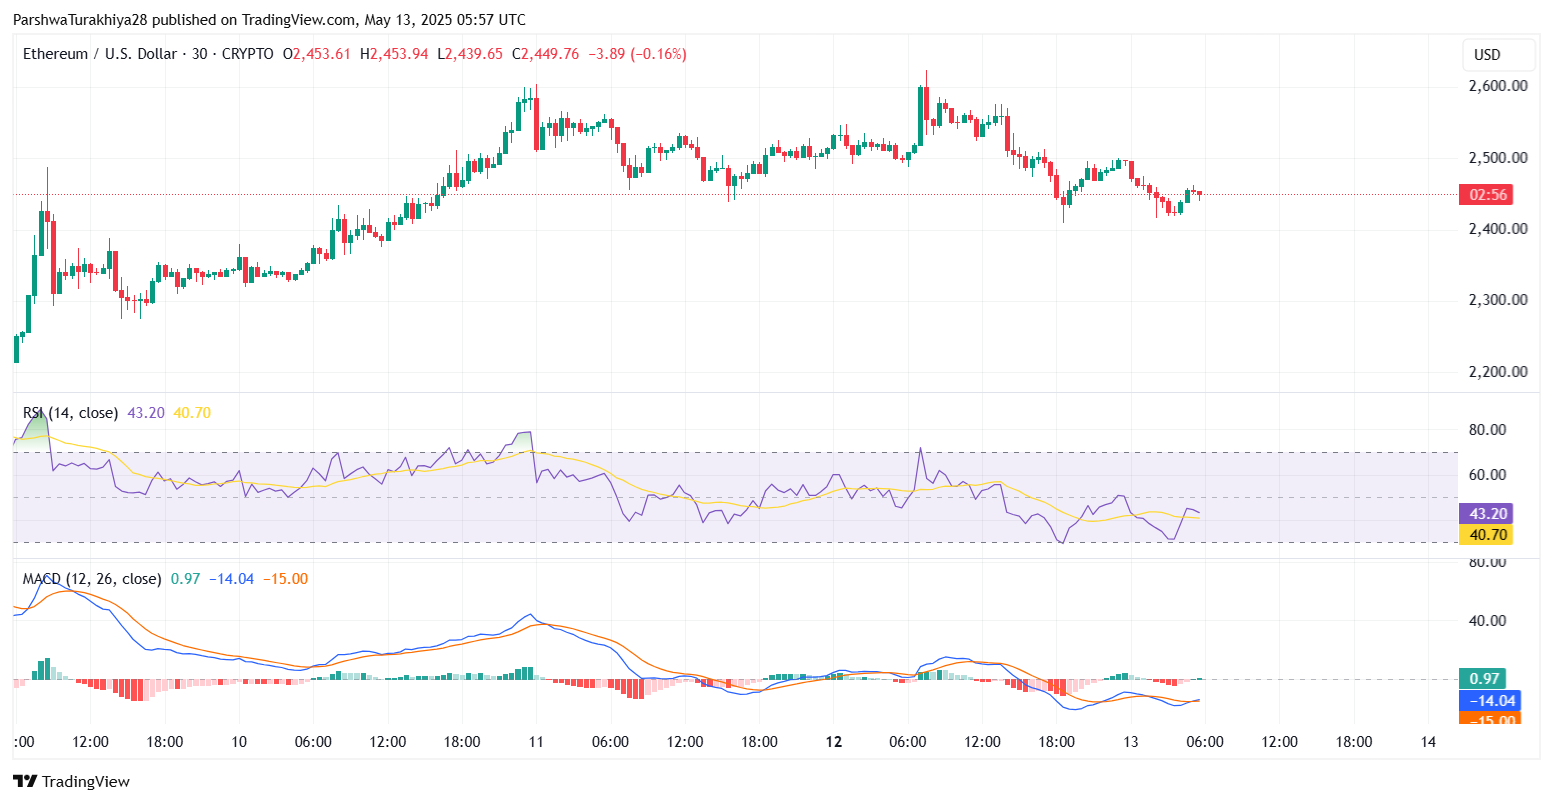
This short-term correction is not unexpected after recent Ethereum price spikes. The RSI on the 30-minute and 4-hour charts hovers near 43–45, suggesting a neutral to slightly bearish bias. However, a reversal in momentum could come quickly if RSI moves back above 50. The MACD histogram has flattened, indicating waning bearish pressure for now.
Why Ethereum Price Going Down Today?
 ETH/USD price dynamics (Source: TradingView)
The answer to why Ethereum price going down today lies in lower time frame exhaustion. After a parabolic rally between May 8–11, ETH faced overhead resistance at $2,600, triggering mild profit-taking. Price is also reacting to the red zone marked around $2,555–$2,600, which aligns with prior liquidity pockets seen on the 30-minute chart. This area remains a stubborn resistance and will likely define whether ETH continues higher or breaks below $2,420.
 ETH/USD price dynamics (Source: TradingView)
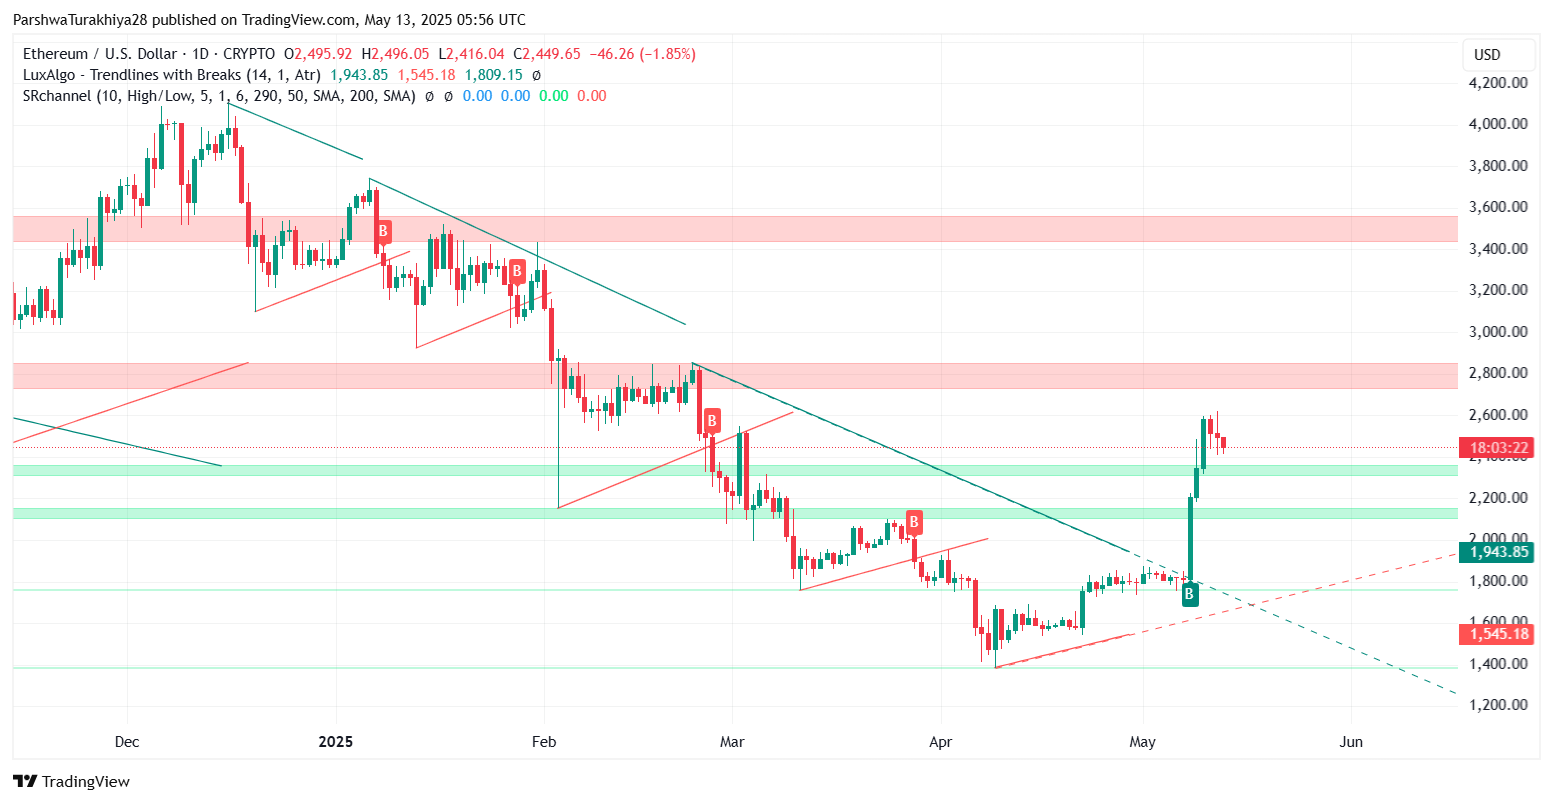
The broader structure on the daily chart shows that ETH remains above the major downtrend breakout level near $1,940, which was reclaimed last week. That said, Bollinger Bands are starting to contract on the 4H timeframe — signaling reduced Ethereum price volatility in the near term.
Short-Term Outlook: Can ETH Price Retest $2,600?
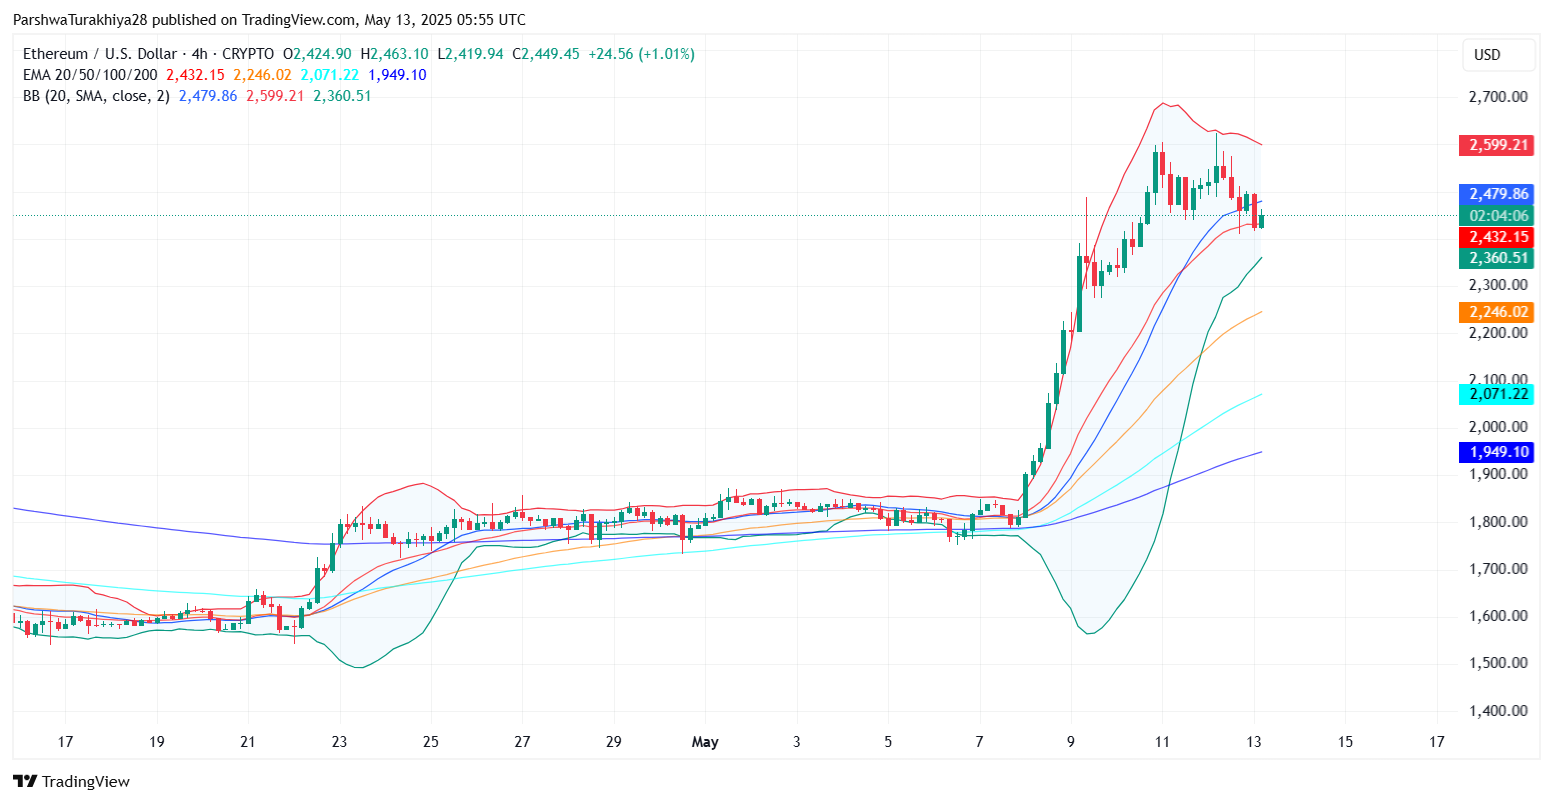 ETH/USD price dynamics (Source: TradingView)
As long as ETH holds above $2,420, bulls retain the upper hand. A bullish breakout from the descending flag could lead to a retest of $2,555 followed by $2,600. Beyond that, the next key target lies at $2,745 (Fib 0.5 level). On the downside, a breakdown below $2,420 opens the door toward $2,300 and then the $2,246 (EMA50) zone.
Traders should watch for a breakout from the flag structure and volume confirmation near $2,460–$2,480. If momentum fails, Ethereum may retrace toward its EMA100 ($2,071) as a deeper retest.
Ethereum Price Forecast Table
| Technical Indicator | Value / Signal |
| Ethereum price today | $2,445 |
| Key Resistance Levels | $2,555, $2,600, $2,745 |
| Key Support Levels | $2,420, $2,300, $2,246 |
| RSI (4H) | 43.2 (Neutral-Bearish) |
| MACD (30-min) | Bearish Crossover Fading |
| Pattern Watch | Bullish Flag Formation |
| Trend Bias (Short Term) | Sideways to Bullish |
| Volatility Outlook | Decreasing in short term |
Disclaimer: The information presented in this article is for informational and educational purposes only. The article does not constitute financial advice or advice of any kind. Coin Edition is not responsible for any losses incurred as a result of the utilization of content, products, or services mentioned. Readers are advised to exercise caution before taking any action related to the company.


