
MANTRA Technical Charts Look Worse than the Terra LUNA Collapse

OM’s price collapse has yet to attract buyers, with technical indicators showing no sign of accumulation. Bearish pressure still dominates.
Yesterday, MANTRA (OM) suffered a staggering 90% crash, and it’s still spiraling down today. Most notably, OM charts and indicators seem as bad as the 2022 Terra LUNA collapse, if not worse. OM’s RSI is hovering near extreme oversold levels, and indicators reflect there’s barely any buying activity. When LUNA collapsed, a large number of traders bought the crash for a short-term pump. But, even this seems unlikely for MANTRA, based on current charts.
OM RSI Reached Levels Below 10
After crashing more than 90% in a matter of hours, some traders may be eyeing MANTRA’s OM token as a potential “buy the crash” opportunity.
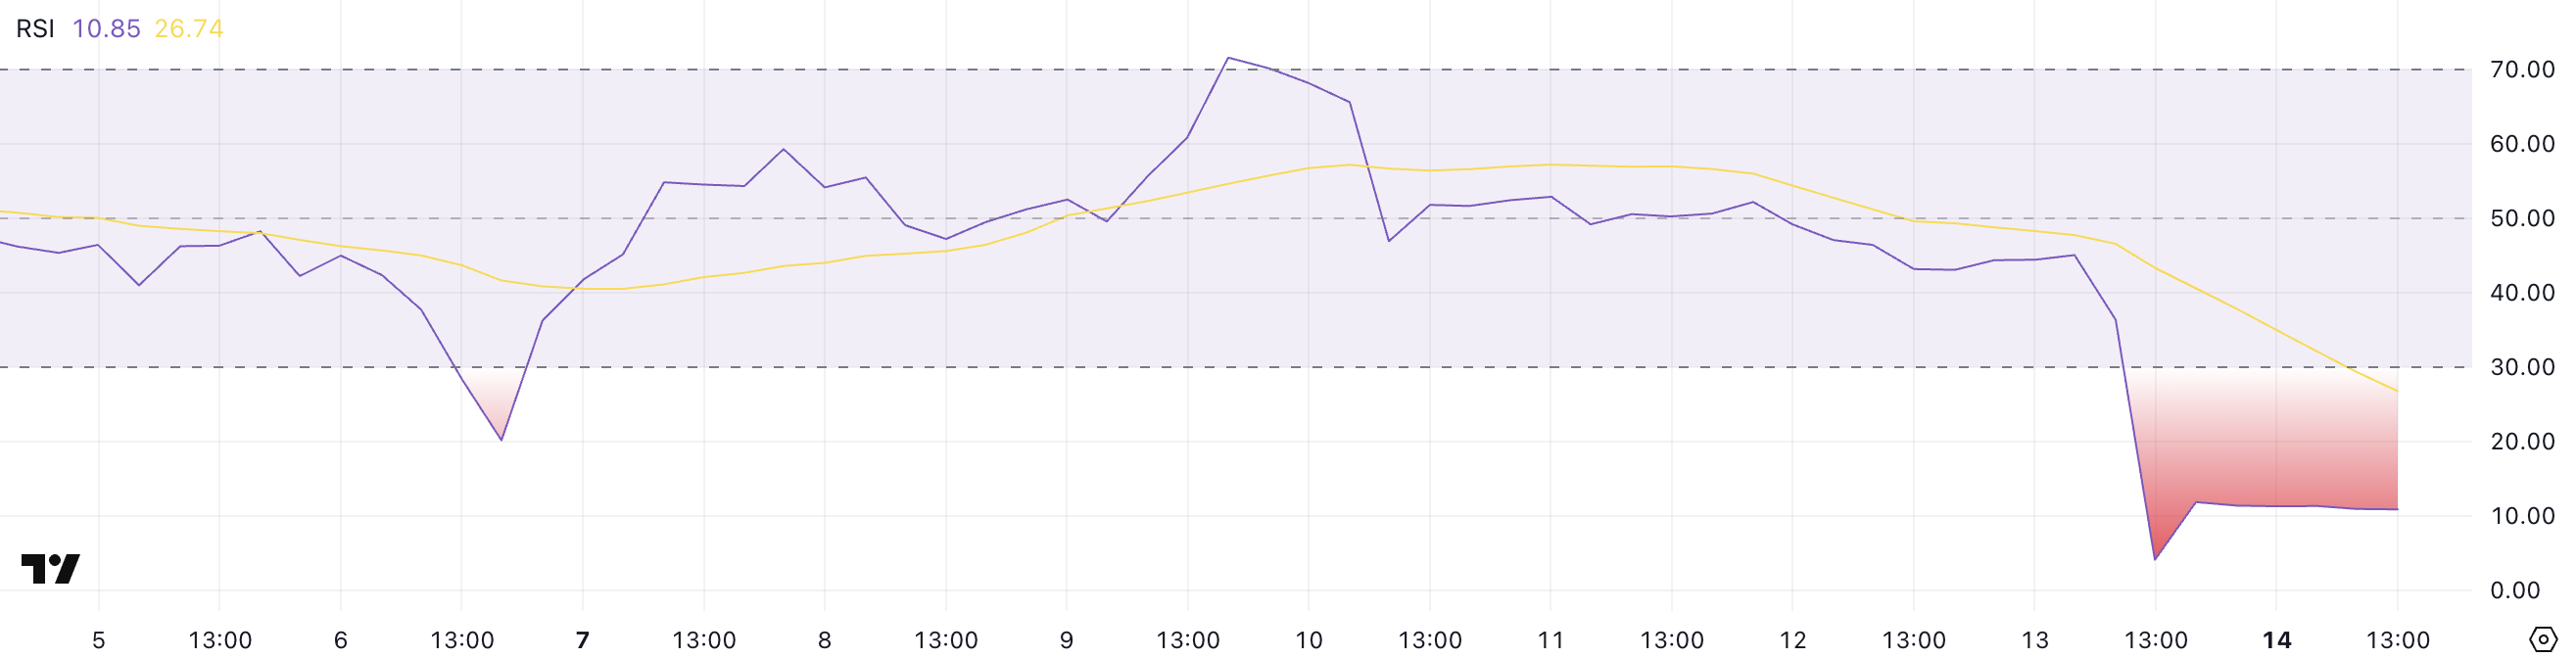
However, the Relative Strength Index (RSI) tells a different story—OM’s RSI plummeted from 45 to 4 during the collapse and has only slightly recovered to 10.85.
The RSI is a momentum indicator that measures the speed and magnitude of price changes on a scale from 0 to 100. Typically, values below 30 indicate oversold conditions, while levels above 70 suggest the asset is overbought.
 OM RSI. Source:
TradingView.
OM RSI. Source:
TradingView.
Despite bouncing from extreme lows, OM’s RSI has hovered around 10.85 for several hours, signaling that very few buyers are stepping in to support the price.
This lack of follow-through buying pressure shows that sentiment remains heavily bearish, and traders are not yet confident enough to accumulate the token—even at these steeply discounted levels.
Recently, talking to BeInCrypto, analysts warned about Mantra’s potential lack of true on-chain value.
OM is potentially setting up for further downside or a prolonged period of stagnation as the market waits for a catalyst or clearer recovery signals.
Mantra DMI Shows Buying Activity Is Almost Non-existent
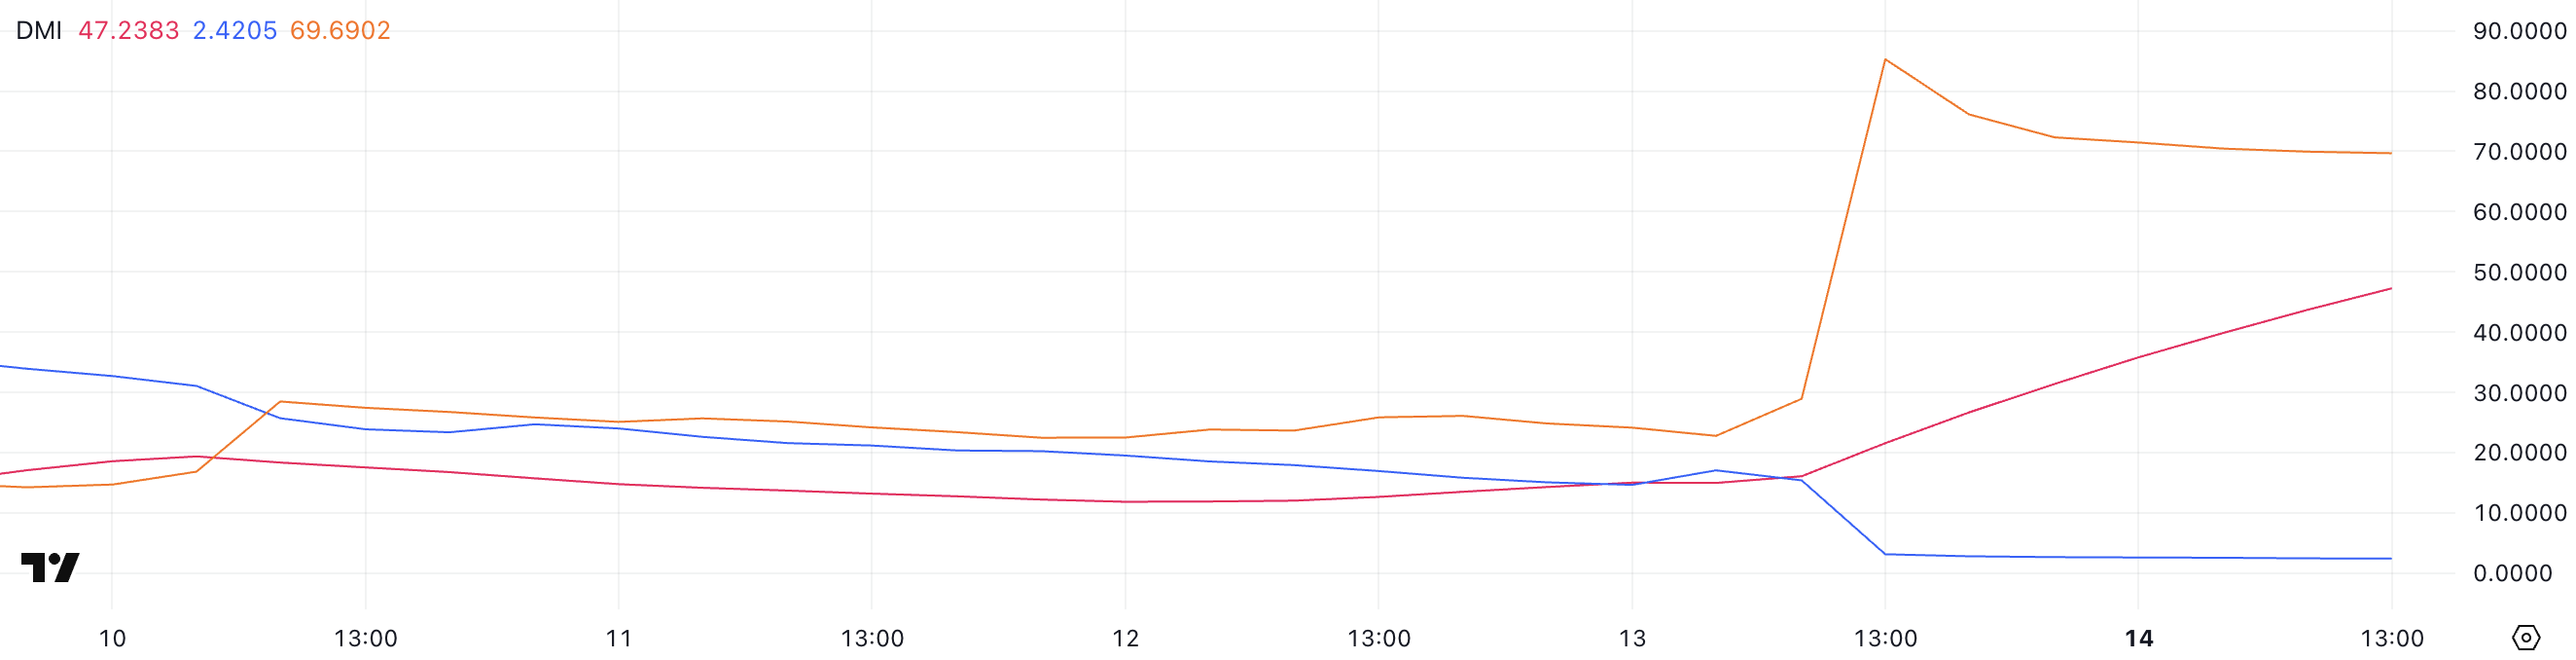
Mantra’s DMI (Directional Movement Index) chart clearly shows intense bearish momentum. The ADX, which measures the strength of a trend regardless of direction, is currently at 47.23—well above the 25 threshold and showing no signs of weakening.
The -DI, which tracks selling pressure, has decreased from its peak of 85.29 to 69.69, indicating that while the panic sell-off may be slowing, it remains dominant.
Meanwhile, the +DI, which measures buying pressure, has dropped from 3.12 to just 2.42, highlighting a complete lack of bullish response to the collapse.
 OM DMI. Source:
TradingView.
OM DMI. Source:
TradingView.
This imbalance reveals that although the worst of the immediate selling may be over, virtually no meaningful buying activity is stepping in to support OM’s price.
The fact that +DI remains extremely low suggests traders are still avoiding the token, hesitant to buy even after a massive discount.
As long as this dynamic continues—strong trend strength, high selling pressure, and near-zero buying pressure—OM is likely to stay under severe bearish pressure, with any recovery attempt extremely unlikely unless sentiment shifts dramatically.
Disclaimer: The content of this article solely reflects the author's opinion and does not represent the platform in any capacity. This article is not intended to serve as a reference for making investment decisions.
You may also like
Chip orders begin to bind capital
30 trillion knowledge work, 30 trillion consumer market -- Mastering the AI inference era
Morgan Stanley believes that AI will reshape the $20-30 trillion knowledge work market and the $30 trillion consumer market, with corporate AI spending potentially reaching $800 billion by 2027. Open-source models are driving down Token prices, triggering explosive demand growth; multiple monetization paths are yielding returns of 25%-50%. Global computing power capacity will soar from 35GW to 145GW, but electricity and regulatory bottlenecks will become the most critical physical constraints in the next phase.
Morgan Stanley: Semiconductors Will Hit the Bottom This Fall!

Hedge funds aggressively go long on the yen: Betting on breaking above 150 by year-end, aiming directly for 140
Hedge funds are betting that USD/JPY will fall below 150 by the end of the year.

Crypto prices
More


