

- PUMP remains near $0.00635 after testing $0.00667, with resistance limiting momentum following its latest advance on the chart.
- Daily volume fell 31.9%, while price stayed near $0.00635, suggesting reduced participation during the latest market consolidation.
- Circulating supply remains below half the maximum, leaving a wide gap between current market value and fully diluted valuation today.
PUMP has extended its recovery toward a historically contested zone, while declining daily volume and repeated intraday reversals point to a market facing renewed resistance after several months of gains.
Price Recovery Meets Renewed Resistance
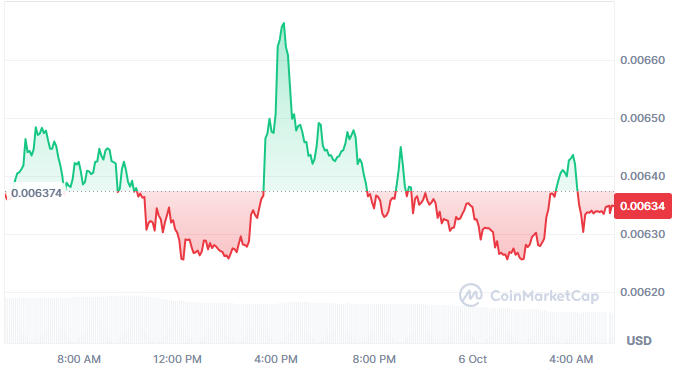
The price as of writing is close to $0.006351 with a change of -0.85% over 24 hours. The intraday chart indicates that there is a strong trend between $0.00627 and $0.00667. Price currently sits near the middle of that range after several reversals.
The strongest advance occurred around the session’s midpoint, reaching approximately $0.00667. Sellers then pushed the price lower toward the $0.00635 region. A later recovery toward $0.00645 also failed to maintain its momentum.
This pattern indicates continued two-way activity around the current trading area. The repeated recoveries have not yet produced sustained progress beyond recent highs. As a result, the upper range remains an important reference for the present structure.
Trading Activity Signals A Slower Market
Daily volume stands near $241.74 million, representing a 31.9% decline. That contraction contrasts with relatively contained price movement during the latest session. Lower activity suggests participation has weakened while the market consolidates.
The valuation by the volume to market capitalization is still at the level of 8.24%. This is still a significant share of market value in terms of trading volume. However, the recent volume decline indicates less turnover than earlier periods.
The chart also shows several unsuccessful pushes above the $0.0064 region. Each advance was followed by renewed selling around higher levels. This behavior keeps the current recovery connected to a broader resistance structure.
In the past, you will find some context to the last shift. The token was moving towards around $0.0088 before making a strong bearish turnaround. Another recovery later came close to $0.0065 only to fade.
Supply Structure Adds Longer-Term Context
The current market capitalization stands near $2.94 billion. Its fully diluted valuation reaches approximately $6.35 billion, creating a substantial valuation gap. That difference reflects the large amount of supply outside current circulation.
Circulating supply is approximately 464.12 billion tokens against a maximum supply of one trillion. Therefore, less than half the maximum supply currently circulates. Future supply changes can alter the relationship between market capitalization and diluted valuation.
It’s also reporting a total of approximately 288,000 holders across the ecosystem. Holder numbers are not a representation of the concentration of ownership. Consequently, the metric provides limited information about individual holder distribution.
The daily chart is still quite far from its July low of around $0.0013. Recovery momentum carried price through $0.0026, $0.0031, $0.0047, and $0.0055. Those levels are now historical support levels under the current market.
The current setup appears to have a good recovery in place and likely to remain active until 0.0060-0.0064 is broken. The data for declining volume indicates that there is some movement now that is less involved. So it’s back to market resistance, activity and skyrocketing supply valuation gaps.


