
This Goldman Sachs report holds clues to the next round of catch-up gains in the US stock market

As of October 2, net leverage of U.S. fundamental long/short funds tracked by Goldman Sachs’s prime brokerage decreased for the third consecutive week, down 2.2 percentage points this week to 46.4%. This is the lowest level since April 2025, ranking at the 2nd percentile over the past five years.
During the same period, the Nasdaq 100 reached an all-time high, while the S&P equal-weight index fell for a seventh straight week.
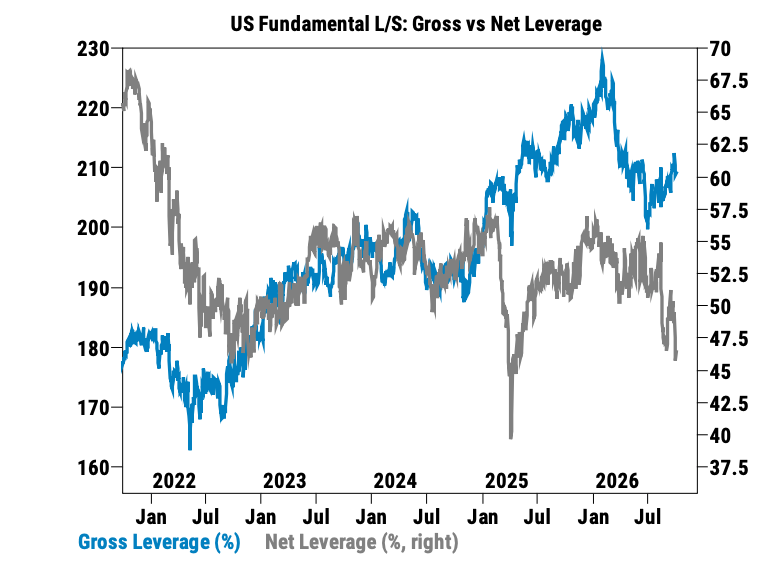
According to U.S. Stock Investment Network, these data suggest that overall institutional net long exposure is low, with funds still focused on a few strong sectors. There is still potential buy-side interest in the market, but whether it can materialize will depend on interest rates and earnings reports.
Let’s first look at how the institutions are actually trading.
From September 25 to October 1, sample funds were mild net buyers of U.S. equities.
Among them, products such as index funds and ETFs saw their largest net buying in two months, mainly driven by short covering.
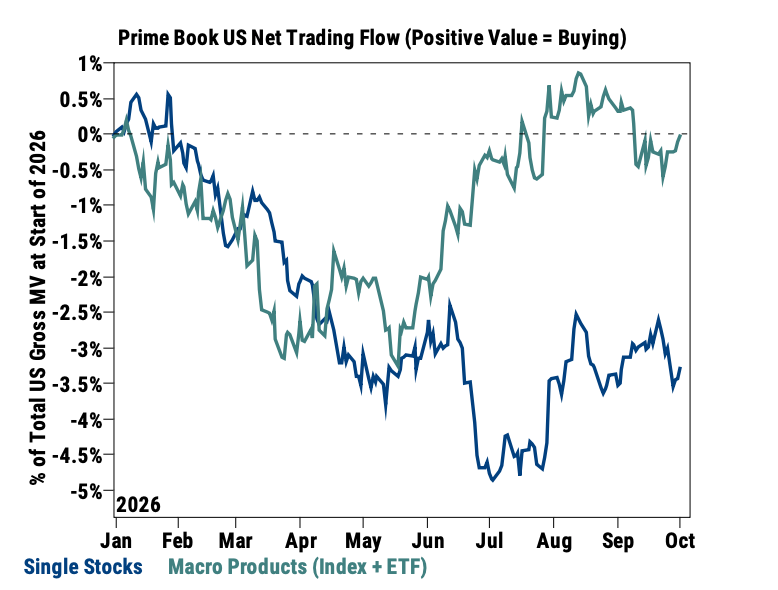
Individual stocks, however, experienced net selling for the second week in a row, with new short positions about 1.5 times the amount of long purchases. Out of 11 sectors, 8 saw net selling, with the largest amounts in communication services, consumer discretionary, and materials.
Buying back index shorts while continuing to short individual stocks is the main feature of this week’s capital flows. This means funds are reducing their bets on broad market declines, but without simultaneously expanding bullish bets on most companies.
Low net leverage does not mean most of the fund's assets are in cash. During the same period, total leverage was still at 209.2%, with the long/short market value ratio dropping to 1.57, ranking at the 1st percentile in the last five years.
You can think of it as: institutions are still actively trading, but after offsetting both long and short positions, net exposure to overall upside is very low.
Looking at sectors, the most notable changes occurred in healthcare and energy.
Healthcare posted its fastest net buying in over six months, almost entirely from short covering. The covering scale was the largest since October 2022, at the 99th percentile of the past five years.
Biotechnology, pharmaceuticals, and life sciences tools and services all showed similar trends. However, the long/short market value ratio of the healthcare sector is still only 2.29, near a one-year low; on a monthly basis, the sector is still seeing net selling.
Therefore, this week’s buying in healthcare is better understood as “widespread short retreat.” Whether there will be sustained active accumulation ahead will determine if it can move from a rebound to an upward trend.
Energy is the opposite.
Sample funds have been net sellers of energy stocks for six consecutive weeks, and eight out of the past nine weeks. New short positions are about twice as large as long purchases; on a monthly basis, energy is the most sold U.S. sector.
Relative to the Russell 3000, energy allocation has shifted from about 1% overweight in July to 0.4% underweight now.
Despite elevated oil prices, institutions continue to expand energy shorts. This indicates they are more cautious about the future returns of energy stocks than current oil prices. The profit drivers for refining, oil services, and integrated oil & gas are different; you can’t judge the whole sector simply by “high oil prices.”
In technology, differences in strength are also evident.
This week, the semiconductor index rose about 4%, while the Nasdaq 100 was up about 0.7%. The optical networking theme basket was up 9.09%, and the data center basket rose 3.35%; quantum computing and global rare earths baskets dropped 5.59% and 5.57%, respectively.
Funds are picking specific segments in the AI industry chain, and are not generally buying into all popular tech themes.
As of September 29, MAGS, which holds the seven tech giants, saw net inflows for 12 out of the past 13 trading days. Compared with persistent weakness of the equal-weight index, the capital concentration becomes even clearer.
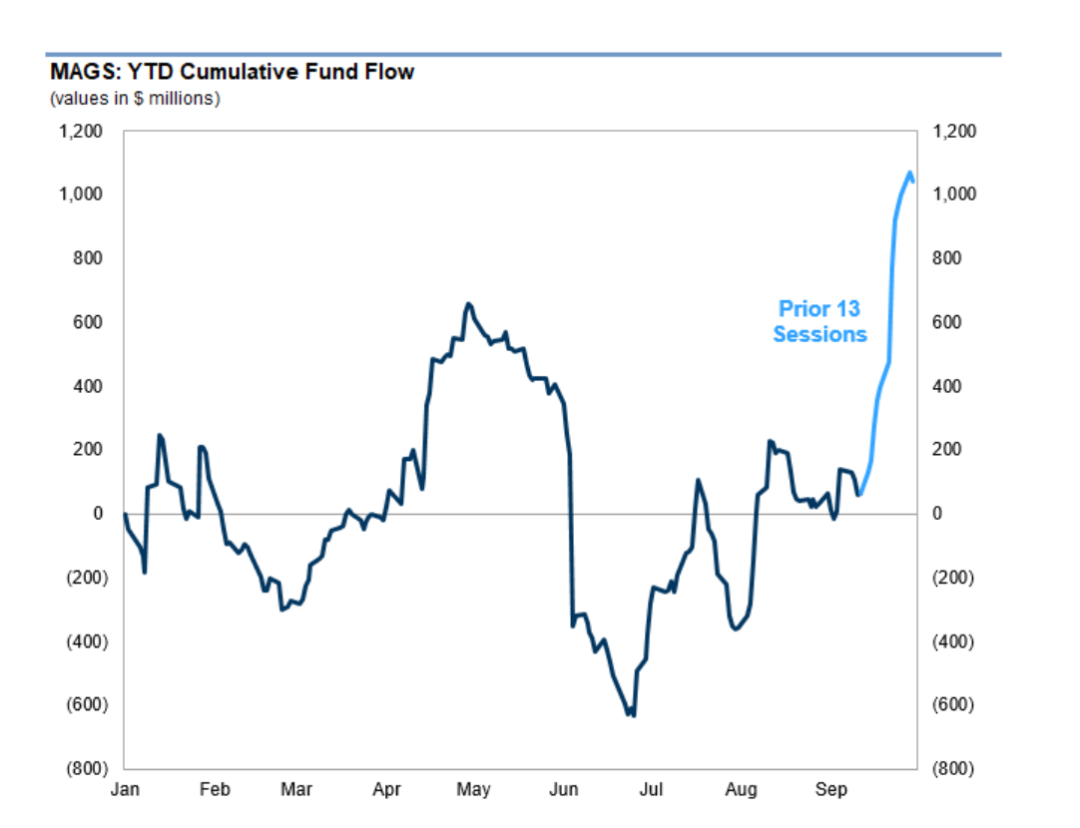
But there is also a potential opportunity here: with low institutional net exposure, if macro pressures ease, under-allocated funds and shorts could both become new buyers.
Small caps are the most direct observation point.
Goldman Sachs estimates that systematic positioning in the Russell 2000 is in the 7th percentile of history; as of September 22, CFTC data showed leveraged fund short exposure at record levels.
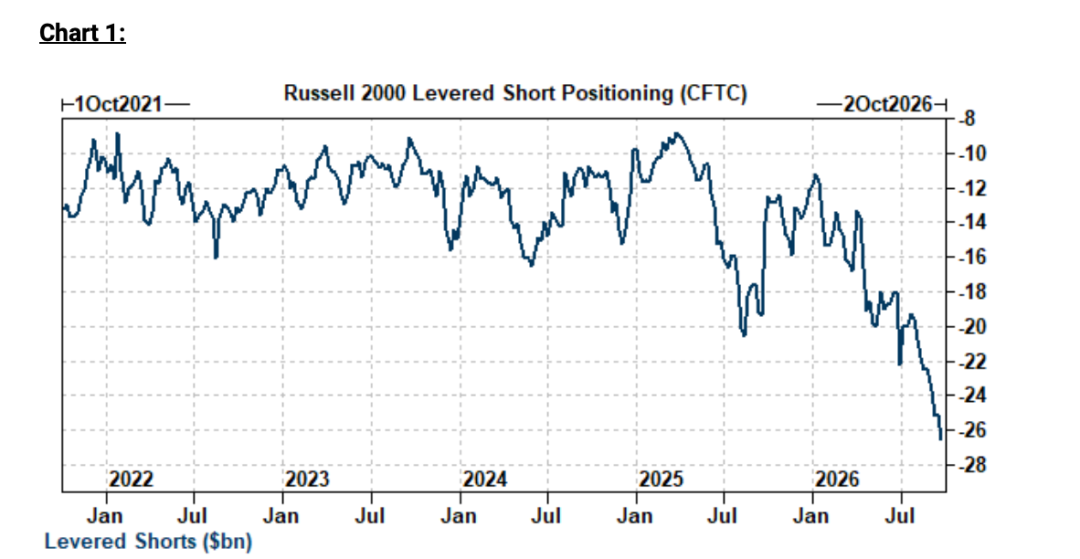
Since September 29, open interest in Russell futures has decreased by about $900 million, and trading desks have observed signs of short covering.
This is why some desks are watching for upside opportunities in IWM: positions are very light, shorts are crowded, and if rates continue to improve, short covering and re-accumulation could together drive a catch-up rally.
The condition is also clear—long-term rates need to genuinely ease. Small caps are more sensitive to financing costs, and a brief dip in yields is not enough to support sustained buying.
Tech stocks must also get through earnings season.
According to trading desks, the Nasdaq 100’s expected P/E ratio for the next 12 months is below its multi-year average, leading some desks to focus on QQQ’s upside exposure.
But this view depends on future earnings being realized. Forecast profits cannot be treated as money already earned.
Options pricing also provides a perspective: the 1-month and 3-month implied volatility for QQQ is at the 36th and 34th percentiles, respectively, over the past year; for IWM, the respective percentiles are 34 and 18.
These percentiles suggest that, compared to their levels over the past year, implied volatility in options is not high. This does not directly prove options are cheap, nor does it mean buying them guarantees high win rates.
The most valuable aspect of the capital data this week, according to U.S. Stock Investment Network, is that both possibilities are presented:
1. If rates continue to fall and earnings beat expectations, light positions and many shorts could amplify the rally, and lagging sectors may catch up.
2. If rates remain high and earnings forecasts are downgraded, funds may remain concentrated in a few leaders, with continued index strength but weakness in most stocks.
Going forward, whether the market becomes sturdier will depend on three changes: whether net selling of single stocks ends, whether net buying comes more from active accumulation, and whether the equal-weight index starts to keep up.
If only short covering happens, a rebound can occur; but for the rally to have more staying power, more funds need to be willing to buy and hold.
Join U.S. Stock Investment Network VIP
Master position management strategies and analyze in depth every U.S. stock you own




Disclaimer: The content of this article solely reflects the author's opinion and does not represent the platform in any capacity. This article is not intended to serve as a reference for making investment decisions.
You may also like
WLD Price Nears $0.70 Resistance — 3 On-Chain Signals Reveal the Next Move
Analyst Jordi Visser Predicted What Might Happen to the Bitcoin Price for the Rest of the Year

Bitcoin price to $90K? BTC/Gold ratio signals a key liquidity shift
Famous Crypto Analyst Says, “I Was Wrong”: “Bitcoin’s Four-Year Cycle Is a Complete Illusion”
Crypto prices
More


