
Cycurion stock surges 42% to $3.82, key resistance at $4.97 eyed for next session

Cycurion stock surged 42% on Friday, closing at $3.82 after an explosive session that swung between $2.64 and $4.95. Volume reached 48,818,864 shares.
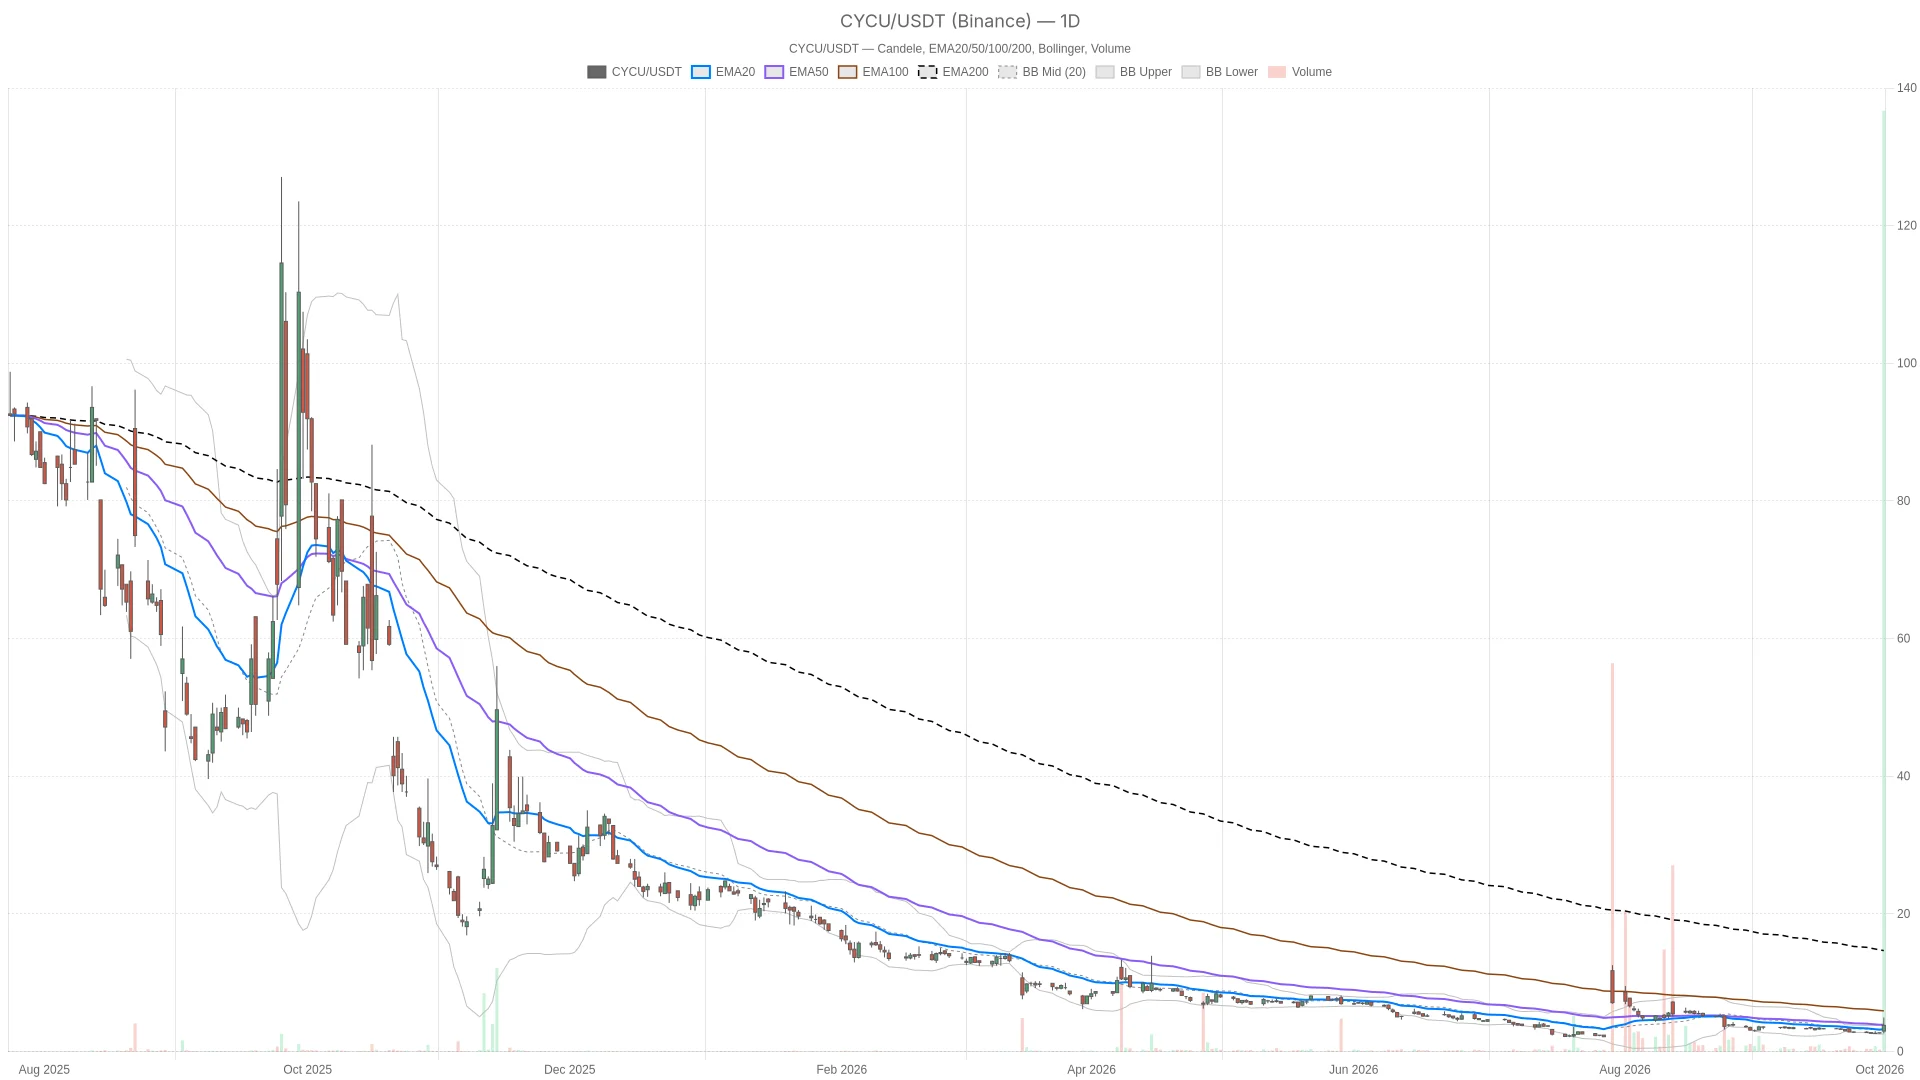 CYCU — daily chart with candlesticks, EMA20/EMA50 and volume.
Summary
Key takeaways
- Cycurion stock closed Friday at $3.82, up 42.01% from the previous close of $2.69, after ranging from $2.64 to $4.95.
- Volume reached 48,818,864 shares.
- Daily momentum is improving but unconfirmed — price sits above the 20-session EMA ($3.26) yet below the 50-session EMA ($3.90) and the 200-session EMA ($15.53).
- Investing.com reported before Friday’s open that Cycurion regained Nasdaq’s minimum bid price compliance.
- Key levels for the next session: daily pivot at $3.80, resistance (R1) at $4.97, support (S1) at $2.66.
Cycurion stock opened Friday at $2.98 and closed at $3.82, marking a 42.01% gain versus the previous close of $2.69 on October 1. Measured from its own open to its own close, the stock advanced 28.19% intraday. Volume came in at 48,818,864 shares.
A swing from $2.64 to $4.95 in a single session signals this was not a quiet grind higher. It was a volatility event. The daily average true range (ATR14) sits at $0.54. Friday’s range dwarfed that figure, confirming how stretched the session was relative to recent norms. Any near-term outlook for Cycurion stock must therefore balance the strength of the advance against the risk inherent in such an expansion.
Daily Chart: Momentum Improving, But Price Still Caught Between Averages
Price Position Relative to Key Averages
On the daily timeframe, price structure is mixed rather than cleanly bullish. The close of $3.82 sits above the 20-session EMA at $3.26, which is constructive. However, it remains below the 50-session EMA at $3.90, and well below the 200-session EMA at $15.53. This is not a stacked bullish trend. It is a market still working to repair a much larger average above it, with short-term momentum only recently turning positive.
Momentum Indicators Show Early Turn
Daily RSI14 reads 56.78, which is neutral-to-constructive, not overbought. The MACD line sits at -0.29 against a signal line of -0.36. That puts the line above its signal with a positive histogram of 0.07. Both lines remain below zero, however, so broader daily momentum is still technically negative, even as short-term momentum improves. The trend is not yet confirmed bullish — it is in the process of turning.
Bollinger Bands and Pivot Levels
The daily Bollinger setup adds another layer. Price at $3.82 sits just below the upper band at $3.86 and far above the mid-band at $3.19. That is a classic signature of a strong breakout day pressing against its own volatility envelope. Little room remains before the band itself must expand or price must pause. For the next session, the daily pivot sits at $3.80, with first resistance (R1) at $4.97 and first support (S1) at $2.66.
Hourly Timeframe Adds Partial Confirmation
On the 1-hour chart, Cycurion stock closed at $3.82 above all three EMAs. The 20-hour EMA sits at $3.27, the 50-hour at $3.09, and the 200-hour at $3.64. That is encouraging for bulls. However, the internal order is not a clean stack. The 200-hour EMA sits above both the 20-hour and 50-hour averages. Price is therefore pushing through a layered resistance zone rather than riding a fully aligned uptrend.
Momentum on this timeframe is more convincing. Hourly RSI14 stands at 67.28, approaching overbought territory without having crossed it. The hourly MACD line is at 0.27 versus a signal of 0.16. That puts the line above its signal with a positive histogram of 0.11 — both values are positive, marking a genuinely bullish momentum read. Meanwhile, the hourly pivot for the next session sits at $3.74, with resistance (R1) at $3.90 and support (S1) at $3.67. Price is positioned between the pivot and R1, leaning toward the upper half of that near-term range.
15-Minute View: A Short-Term Pullback Inside the Rally
The 15-minute chart is where the picture gets more interesting. Here, the EMAs are properly stacked bullish. Price at $3.82 sits above the 20-period EMA at $3.73. That sits above the 50-period EMA at $3.42, which in turn sits above the 200-period EMA at $3.12. This is the cleanest bullish alignment across all three timeframes.
Short-term momentum, however, is cooling. The 15-minute MACD line at 0.12 sits below its signal at 0.19, producing a negative histogram of -0.07. RSI14 reads 56.94, neutral. Price has also slipped below the 15-minute Bollinger mid-band at $3.91, though it remains above the lower band at $3.60. Taken together, this points to a short-term pullback or consolidation inside a broader intraday uptrend, rather than a reversal. The 15-minute pivot for the next session matches the hourly levels: pivot at $3.74, R1 at $3.90, S1 at $3.67.
Nasdaq Compliance News
Alongside the price action, Investing.com reported before Friday’s open that Cycurion had regained Nasdaq’s minimum bid price compliance. The report was published at 08:36 ET, ahead of the session’s open. The development is worth noting as context for the day. Still, the scale of the subsequent price swing is best read through the charts themselves rather than attributed solely to this report.
Bullish Scenario
For Cycurion stock to build on Friday’s advance, the first test is the daily 50-session EMA at $3.90. Price has not yet reclaimed this level on a closing basis. Clearing it, followed by the daily first resistance (R1) at $4.97, would mark a genuine extension of the move. Supporting evidence would include the daily MACD histogram continuing to widen on the positive side. RSI14 would need to hold above the mid-50s without racing into overbought extremes. The hourly chart would need to stay above its pivot at $3.74. If the 15-minute chart can reclaim its Bollinger mid-band at $3.91 and flip its MACD histogram back positive, the short-term pullback would have run its course. That would signal buyers are back in control.
Bearish Scenario
In contrast, the bearish case centers on a failure to hold ground already won. Losing the daily 20-session EMA at $3.26 would be the first warning sign. It would undermine the one daily average price currently sits above. Below that, the daily Bollinger mid-band at $3.19 and then daily first support (S1) at $2.66 become the levels to watch.
On the hourly chart, a break below the pivot at $3.74 and then support (S1) at $3.67 would weaken the near-term structure meaningfully. This is especially true with hourly RSI14 already elevated at 67.28 and vulnerable to a rollover. The negative 15-minute MACD histogram already hints at fading short-term momentum. If that weakness spreads to the hourly timeframe, the bullish 15-minute EMA stack could unwind quickly, given how far price extended in a single session.
Where Cycurion Stock Stands Now
Overall, Cycurion stock closed Friday’s session at $3.82, up sharply from the previous close of $2.69. The session ranged from $2.64 to $4.95 on volume of 48,818,864 shares. The daily chart shows improving but unconfirmed momentum. Price sits above its 20-session EMA yet still below both the 50-session EMA and the much higher 200-session EMA.
The hourly chart leans more constructively, with price above all three of its EMAs and a positive MACD reading. Meanwhile, the 15-minute chart shows a fully bullish EMA stack cooling into a short-term pullback. Key levels to track into the next session include the daily pivot at $3.80, hourly and 15-minute pivots at $3.74, and the wider daily range between support (S1) at $2.66 and resistance (R1) at $4.97.
Volatility remains elevated across every timeframe. With the daily ATR14 at $0.54 dwarfed by Friday’s own range, the next session could just as easily extend the move as retrace a portion of it. What remains uncertain is whether Friday’s advance marks the start of a sustained recovery or a single outsized session inside a longer-term downtrend still visible against the daily 200-session EMA.
FAQ
What are the key levels to watch for Cycurion stock in the next session?
The daily pivot sits at $3.80, with resistance (R1) at $4.97 and support (S1) at $2.66. On the hourly and 15-minute charts, the pivot is at $3.74, with R1 at $3.90 and S1 at $3.67. The daily 50-session EMA at $3.90 and 20-session EMA at $3.26 are also critical thresholds to monitor.
Is Cycurion stock’s rally technically sustainable?
The daily chart shows improving but unconfirmed momentum. Price is above the 20-session EMA ($3.26) but below the 50-session EMA ($3.90). Daily RSI14 at 56.78 is neutral-to-constructive, and the MACD histogram is positive at 0.07, though both MACD lines remain below zero. The hourly chart offers more conviction, with price above all three EMAs and a positive MACD reading. However, the 15-minute chart shows short-term momentum cooling, suggesting a pullback or consolidation may be needed before further gains.
What did the Nasdaq compliance news mean for Cycurion stock?
Investing.com reported before Friday’s open that Cycurion had regained Nasdaq’s minimum bid price compliance. The report was published at 08:36 ET. While the development provides important context for the session, the scale of the subsequent price swing is best read through the technical charts rather than attributed solely to this news.
{"@context":"","@type":"FAQPage","mainEntity":[{"@type":"Question","name":"What are the key levels to watch for Cycurion stock in the next session?","acceptedAnswer":{"@type":"Answer","text":"The daily pivot sits at $3.80, with resistance (R1) at $4.97 and support (S1) at $2.66. On the hourly and 15-minute charts, the pivot is at $3.74, with R1 at $3.90 and S1 at $3.67. The daily 50-session EMA at $3.90 and 20-session EMA at $3.26 are also critical thresholds to monitor."}},{"@type":"Question","name":"Is Cycurion stock's rally technically sustainable?","acceptedAnswer":{"@type":"Answer","text":"The daily chart shows improving but unconfirmed momentum. Price is above the 20-session EMA ($3.26) but below the 50-session EMA ($3.90). Daily RSI14 at 56.78 is neutral-to-constructive, and the MACD histogram is positive at 0.07, though both MACD lines remain below zero. The hourly chart offers more conviction, with price above all three EMAs and a positive MACD reading. However, the 15-minute chart shows short-term momentum cooling, suggesting a pullback or consolidation may be needed before further gains."}},{"@type":"Question","name":"What did the Nasdaq compliance news mean for Cycurion stock?","acceptedAnswer":{"@type":"Answer","text":"Investing.com reported before Friday's open that Cycurion had regained Nasdaq's minimum bid price compliance. The report was published at 08:36 ET. While the development provides important context for the session, the scale of the subsequent price swing is best read through the technical charts rather than attributed solely to this news."}}]}
Article produced with the assistance of artificial intelligence and reviewed by the editorial team.
Disclaimer: The content of this article solely reflects the author's opinion and does not represent the platform in any capacity. This article is not intended to serve as a reference for making investment decisions.
You may also like
MaxLinear stock closes up 14.99% at $105.93, flashes overbought signals
The spread between French and German government bonds has surged to its highest level since the European debt crisis, and the European Central Bank faces a "nightmare scenario": rescue the market or maintain credibility?
The yield spread between French and German 10-year bonds has risen to about 150 basis points, the highest since the 2012 Eurozone debt crisis. France's 5-year Credit Default Swap (CDS) has climbed to around 87 basis points, the highest since early 2013. The market is speculating whether the European Central Bank will deploy the TPI tool. However, France's issues stem from a real and uncontrolled fiscal deficit and a political deadlock, rather than a "baseless and disorderly" market sell-off. If the ECB intervenes, it could undermine its credibility; if it does not, there is a risk of contagion.

Gold bulls disappointed as weak jobs report fails to spark rally, $4,000 support looms
Fluid Trading Strategies Highlighted by Influencer Pentosh1
Crypto prices
More


