
With U.S. Treasury yields continuing to rise and U.S. stock market breadth continuing to deteriorate, why do U.S. stock indices remain resilient, and what is the next move?

The US stock market is currently experiencing a rare internal split. Yields are soaring, market breadth continues to deteriorate, credit spreads are widening, yet the S&P 500 Index remains largely unmoved. Bulls and bears are locked in a stalemate, with market sentiment growing increasingly anxious.
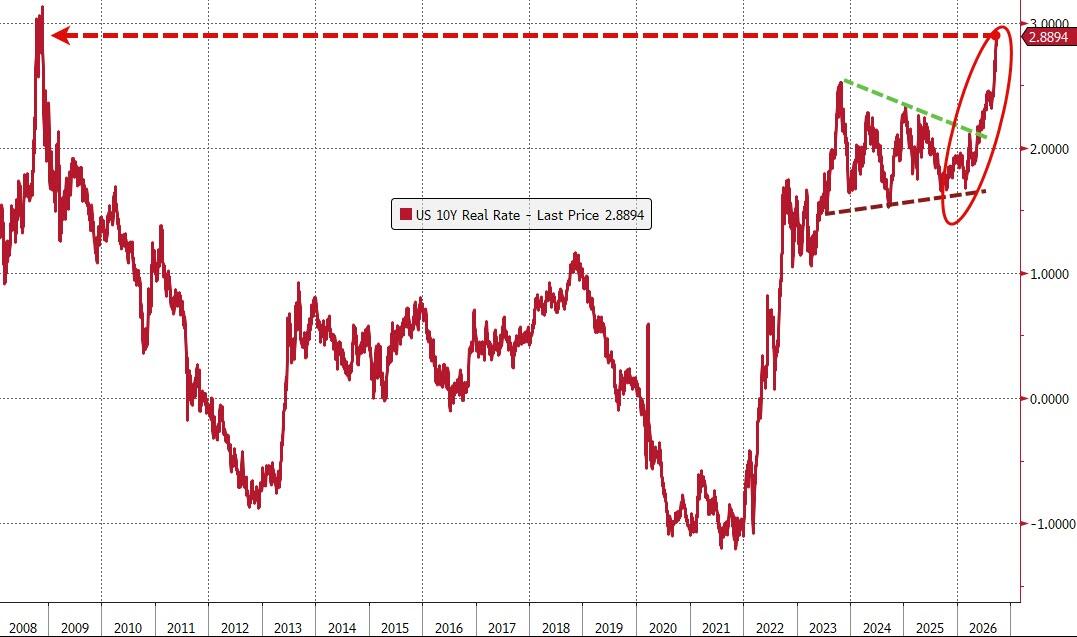
On Wednesday, Rich Privorotsky, head of single delta trading at Goldman Sachs, bluntly stated that the speed of the US Treasury yield spike "is now too severe to ignore," with the monthly rise in real yields at one of the worst levels since 2013. He warned, “The surge in rate volatility is compressing Wall Street’s risk intermediation capacity, and the real pressure on equities is much heavier than what the indices’ surface suggests.”
At the same time, quarter-end rebalancing pressure is mounting—Goldman Sachs estimates that pensions will sell nearly a record $33 billion in equities at the end of this month, while CTA systematic strategies will net sell over $5.3 billion in Russell 2000 futures in the coming week. The combination of these two selling pressures makes the market direction even more uncertain.
BTIG strategist Jonathan Krinsky noted that his conversations with clients “have largely been the same in recent weeks, but the frequency and levels of anxiety are rising every day.” The core issue is simple: The divergence between market breadth, rate trends, and the S&P 500 has become unsustainable, but exactly how it will converge remains unclear.
The Resilient Index Masks Deep Internal Damage
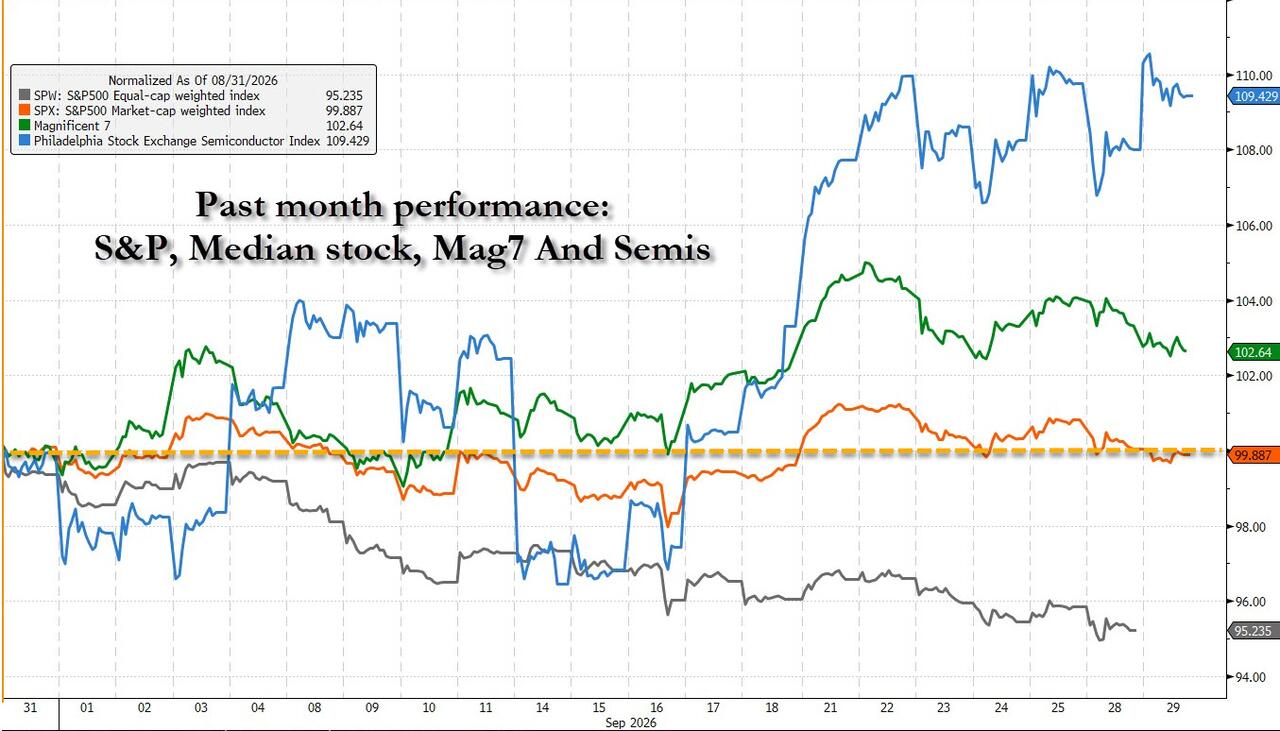
The S&P 500 index has remained nearly flat over the past month, but beneath this calm exterior, structural damage is rapidly accumulating.
Krinsky pointed out that while the S&P 500 was flat over the past month, the median stock fell 4.5%, and the index’s steadiness is entirely reliant on a roughly 10% surge in semiconductors. The Nasdaq 100 has also delivered almost zero gains since mid-August, with only 10 stocks rising more than 10% while 23 stocks have dropped more than 10%. “Breakout buying and momentum-chasing” strategies are failing, with more stocks experiencing larger and more sustained declines.
The weakness in mid-cap stocks is particularly alarming. They have quietly fallen below their 200-day moving average, down more than 8% from recent highs. Meanwhile, the number of new lows on the NYSE has outpaced new highs for 10 consecutive sessions—a signal that has historically preceded broader market pressure.
Goldman’s Privorotsky confirmed this view: “The pain beneath the surface is clear—small-caps, financials, and other rate-sensitive sectors are under much greater pressure than what the apparent calm among mega-cap tech suggests.”
Goldman: Rate Hikes Now Beyond the Breaking Point
In the current market debate, Goldman Sachs’ judgment is especially critical. Privorotsky made it clear that while equities have shown “impressive resilience” so far, the rapid rise in real yields has now triggered a red alert.
Goldman’s analytical framework shows that when rates move up more than two standard deviations, the equity market usually responds—the issue isn’t the absolute level of rates but the speed of the climb. Right now, that threshold has been breached. The monthly increase in real yields has entered one of the worst zones since 2013.
Privorotsky also observed a “peculiar price asymmetry”: when oil prices and rates improve simultaneously, rate risk barely responds; but when oil prices rise, rates come under immediate pressure. He believes that five- and ten-year inflation expectations are still tracking energy prices, but that a considerable portion of the current rates shock comes from rising real yields—not inflation expectations.
His conclusion is straightforward: “I can maintain extreme optimism about AI and its development speed, but for now, unless energy and rate issues are resolved, such optimism is almost meaningless.” The logic is clear: holding down oil prices helps lower rates, and rate stabilization would unlock more room for a broad market rebound.
Quarter-End Rebalancing and CTA Selling: Twin Selling Pressures Mount
Besides fundamental pressure, technical selling is being released in force as quarter-end approaches.
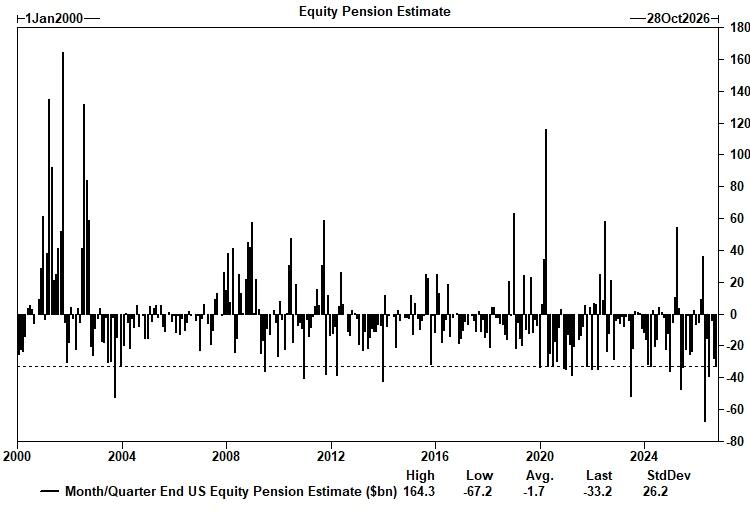
Goldman estimates that pensions will need to sell about $33 billion in equities at month-end and quarter-end combined (around $11 billion for month-end and $22 billion for quarter-end) and buy an equivalent amount of bonds. This volume ranks in the 97th percentile of all estimated flows over the past three years, and in the 98th percentile dating back to January 2000—near historical extremes.
At the same time, Goldman’s CTA models indicate that if prices are flat, systematic managers will net sell about $5.3 billion of Russell 2000 futures in the coming week, making it one of the largest CTA sell estimates in six years.
Privorotsky finds this “tactically compelling,” believing quarter-end and month-end factors should support duration assets, but he also admits that the core contradiction is: given the pension rebalancing bond buying and CTA equity index selling, it remains to be seen which side “blinks” first by quarter-end.
Bull-Bear Stalemate: Who Will Blink First?
In Krinsky’s view, the market is currently in a bull-bear standoff, but neither side has yet been proven right.
The bull case: market breadth is being thoroughly washed out and could sharply recover at any moment; rates will also tumble rapidly at some point. The bear rebuttal: breadth is still degrading, yields are still rising, credit spreads are still widening; the S&P 500 cannot stay unscathed forever.
Krinsky himself leans bearish, though he adds a tactical exception—the Utilities sector (XLU). He notes that when RSI falls below 35, XLU's odds of rising over the next five sessions are 100%, with an average gain of 2.7%, making the current risk-return attractive.
His final view: this divergence will not resolve mildly as the bulls hope—“We believe this will not end until the last holdouts finally capitulate and break downwards.”
The credit market has already started to show cracks that stock market volatility refuses to price in—high-yield credit default swaps (HY CDX) have reached their highest since April, when the VIX was at 19.23, compared to today’s 16.35. This divergence might be the clearest early warning of the market’s next step.
Disclaimer: The content of this article solely reflects the author's opinion and does not represent the platform in any capacity. This article is not intended to serve as a reference for making investment decisions.
You may also like
Ethereum News: Glamsterdam Sepolia Test Set for October 6
Claude AI Predicts BTC Path as a $215K Scenario Takes Shape

Eric Jackson: “Bitcoin Could Reach $100,000 by the End of This Year” – His Long-Term Target Is $50 Million

Smarter Web’s MORE rally is the digital credit win Saylor says he wants

Crypto prices
More


