

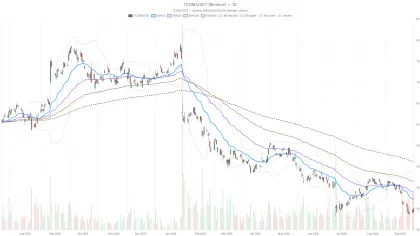
The SUI token hovered between $0.69 and $0.71, approaching the significant $0.67-$0.68 support zone, which analysts describe as a crucial tipping point for the short-term trend. Price action around this level will help determine whether sellers retain control or whether a recovery toward the $0.72 and $0.75 resistance areas comes into view.
SUI trades near key $0.67 support as technical indicators suggest mixed outlook
By:Cointurk
Bitget offers one-stop trading for cryptocurrencies, stocks, and gold. Trade now!
A welcome pack worth 6200 USDT for new users! Sign up now!
SUI faces critical support amid persistent selling
Recent declines pushed SUI near an area where buyers previously showed interest, with the $0.67-$0.68 level emerging as the first line of defense against further downward movement. Below that, the $0.64-$0.65 region provides additional historical demand, while $0.62 is seen as a deeper support reference for the short term.
Technical readings on TradingView continue to signal caution. Daily, weekly, and monthly timeframes remain skewed toward sell signals, mainly driven by moving averages, though oscillators paint a less bearish picture. While the dominant trend still favors sellers, momentum indicators have stopped short of flashing extreme oversold warnings that might suggest a decisive market bottom.
SUI’s immediate future hinges on the defense of support near $0.67, with a rebound likely to face resistance at $0.72 and $0.75. Failure to hold this level could direct the price toward $0.64 or even $0.62, as buyers test historical demand.
The token has struggled to retake longer-term resistance, including the 200-day EMA positioned around $0.84, making sustained upward progress more challenging in the current environment.
Weekly falling wedge and SUI/BTC structure in focus
Beyond immediate support and resistance levels, analysts have highlighted a weekly falling-wedge pattern developing on SUI’s chart. This chart formation, often interpreted as a potential bullish reversal, can signal a significant trend change if the price breaks above the upper boundary and confirms strength.
A similar wedge has been observed in the Relative Strength Index (RSI) on the weekly timeframe. The SUI/BTC pair, tracked on a two-week chart, is described as showing a potential double-bottom near 0.000009 and a gravestone-doji candlestick, both patterns often associated with a possible reversal but requiring subsequent price confirmation before any firm conclusions are drawn.
If an upward breakout from the wedge materializes, some analysts have referenced a potential long-term target in the $1.75-$2 range. However, this scenario remains speculative until current resistance levels are reclaimed and confirmed by price action.
Mini dictionary: Falling wedge — A chart pattern formed when price action contracts between downward-sloping support and resistance lines. When the price breaks above the upper trendline, it is typically viewed as a bullish reversal signal.
Key levels and momentum indicators shape near-term outlook
To strengthen the short-term structure, SUI would need to stabilize above $0.67 and reclaim the $0.70-$0.72 area, according to technical analysts. Clearing $0.72 could open the way to challenge the $0.74-$0.75 resistance band, which remains a key hurdle for bullish traders.
Level Function
| $0.67-$0.68 | Key support zone |
| $0.70-$0.72 | Recovery resistance |
| $0.74-$0.75 | Major technical resistance |
| $0.64-$0.65 | Secondary support |
| $0.62 | Deeper support |
| $0.78-$0.85 | Next significant resistance |
A solid move above $0.75 could serve as confirmation that buyers are regaining near-term control, while failure to hold $0.67 would likely increase focus on the $0.64-$0.65 and $0.62 support zones.
Momentum indicators, including the RSI and MACD, continue to suggest a mixed picture. The RSI currently hovers in the low-to-mid 40s, remaining below the midpoint yet not confirming an oversold market. Meanwhile, MACD readings stay in negative territory, while the Average Directional Index (ADX) points to decent trend strength without signaling a direction. This mix leaves the door open to short-lived rebounds, but does not yet confirm a significant trend reversal.
Market backdrop and price prospects
SUI’s technical picture unfolds as the broader cryptocurrency sector faces renewed volatility. Bitcoin and crypto-related equities slid after the US Senate failed to advance new regulations, with Bitcoin trading near $75,908 at the time. Heightened Treasury yields above 5%, alongside higher oil prices and persistent inflation pressures, contributed to financial market uncertainty.
Analysts believe these macroeconomic trends could influence SUI’s short-term direction, as risk-off sentiment in global markets tends to impact altcoins more severely. This context adds another layer of complexity as SUI approaches its technical inflection point.
The current technical outlook centers on the $0.67-$0.68 support and the $0.74-$0.75 resistance. As long as sellers dominate, support remains vulnerable, but a successful test could enable a near-term recovery. Any bullish breakout would require confirmation above key resistance and may open the door to higher targets if sustained momentum follows.
0
0
Disclaimer: The content of this article solely reflects the author's opinion and does not represent the platform in any capacity. This article is not intended to serve as a reference for making investment decisions.
Understand the market, then trade.
Bitget offers one-stop trading for cryptocurrencies, stocks, and gold.
Trade now!
You may also like
Tonkeeper rebrands to Keeper, adds support for 6 major blockchains
Cointurk•2026/09/16 09:45
"Messi of the AI World" gets another bullish call! Palantir (PLTR.US) long-term bulls reiterate trillion-dollar valuation logic, while "big shorts" and retail investors disagree
Dan Ives reiterates the trillion-dollar valuation theory for Palantir, but prominent bear Michael Burry and retail investor sentiment remain pessimistic.
智通财经•2026/09/16 09:21

Tonight the Fed rate hike is almost certain; the market is closely watching Waller's remarks: will a signal of continued rate hikes be released?
What the market truly cares about is: the dot plot will reveal how many more rate hikes are expected this year, and whether Waller will send signals of ongoing tightening. Citi predicts this will be a “dovish hike”; Goldman Sachs bluntly states that this rate hike lacks sufficient economic basis; Standard Chartered believes the hike itself is a policy mistake. If there’s a signal of aggressive consecutive hikes, it could trigger market turmoil; the most dangerous tail risk is an unexpected pause, which could spark a credibility crisis and sharp equity sell-off.
华尔街见闻•2026/09/16 09:01
Trip.com Group Limited stock hits oversold RSI of 27.48 as hourly momentum stabilizes
Cryptonomist•2026/09/16 08:57
Crypto prices
More
Bitcoin
BTC
$75,822.93
-1.46%

Ethereum
ETH
$2,400.58
-3.03%

Tether USDt
USDT
$0.9991
-0.06%

BNB
BNB
$709.72
-1.03%

XRP
XRP
$1.29
-8.11%

USDC
USDC
$0.9998
-0.01%

Solana
SOL
$97.17
-3.59%

TRON
TRX
$0.3348
-1.21%

Zcash
ZEC
$1,191.74
+4.53%

Hyperliquid
HYPE
$77.53
-1.98%
How to buy BTC
Bitget lists BTC – Buy or sell BTC quickly on Bitget!
Trade now
Become a trader now?A welcome pack worth 6200 USDT for new users!
Sign up now