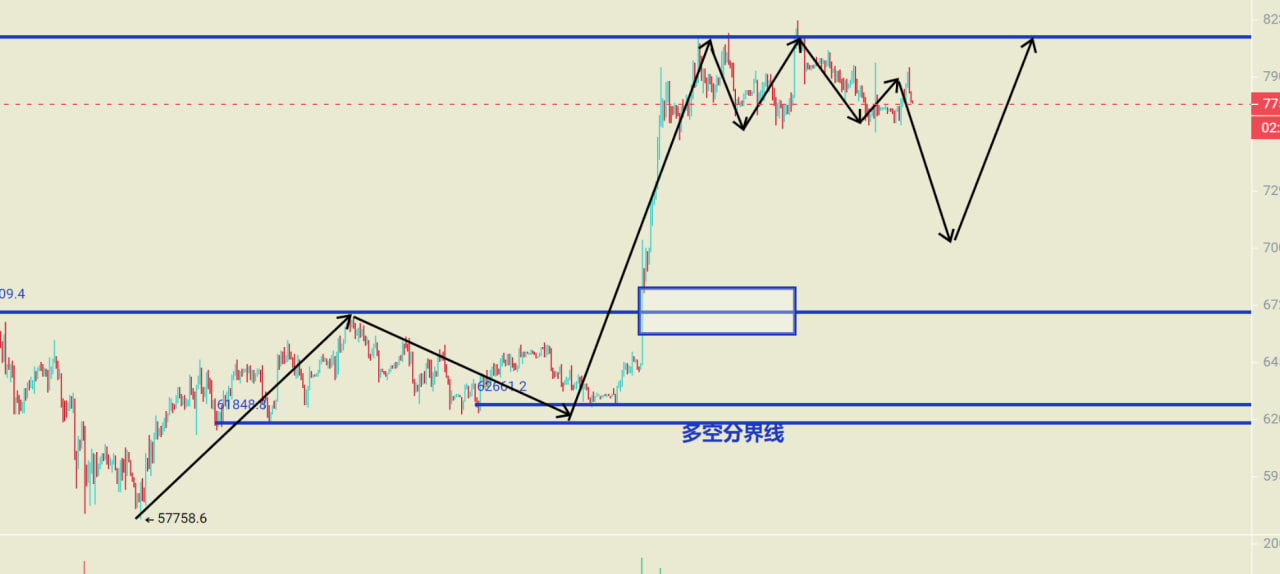
At the start of a new week, the market immediately entered a short squeeze that lasted over 24 hours. The core reason for this BTC rebound is that the daily chart is gradually entering a bottoming correction zone; although ETH is relatively stronger, a large part of its momentum still comes from the BTC rebound and the strengthening of the ETH/BTC rate.
Currently, BTC is neutral and ETH is more bullish, resulting in a significant divergence in strength between the two. This structure is more like a case of capital rotation within a consolidation range, rather than the market kicking off a new round of unilateral gains.
More importantly, this week the market enters the real “eye of the event storm.”
Today, markets are watching the procedural vote related to the CLARITY Act, to be followed by the FOMC decision. As policy expectations heat up, both BTC and ETH's rebounds are directly exposed to macro expectation differences.
Therefore, the most important thing in the next couple of days is not to guess the trend, but to **follow the market, position at key levels, strictly set stop-losses, and avoid overtrading.** If the final outcome materially deviates from the market's prior pricing—whether hawkish or dovish—a swift short squeeze, long liquidation, or even a double wipe-out of longs and shorts could be triggered.
₿ Bitcoin (BTC)
View: Short at highs, long at lows, focus on a consolidation mindset before events play out.
BTC is still in the lower region of the large 76,400—82,400 range. Short-term momentum has improved, but no clear breakout trend has formed.
Since the MACD death cross about 10 days ago, it has remained in a weak zone, although the histogram has narrowed from around -781 to about -652, indicating that bearish momentum is gradually easing.
Meanwhile, the medium-term structure is still resilient and capital support below has not disappeared.
There's also no sign of overheating in derivatives. BTC's weighted funding rate for both open interest and volume remains around 0.009%, a relatively neutral level, suggesting long and short forces are balanced.
Therefore, it's not suitable to go heavy in a single direction before the event resolves:
Watch for support to see if capital steps in on pullbacks; watch for price stagnation at resistance. Only switch to a trending mindset after a true volume breakout.
Support: 77,400-77,700; 76,000-76,400
Resistance: 78,500-79,000; 79,500-80,000; 80,700
⟠ Ethereum (ETH)
View: Short at highs, long at lows; closely monitor both BTC and ETH/BTC rate.
ETH has recently outperformed BTC, but its independent move mostly comes from a continued rise in the ETH/BTC rate.
So, ETH now needs attention in two areas: BTC determines the market's risk appetite, while ETH/BTC determines ETH’s performance relative to BTC. If either side sees major moves, ETH typically follows that direction.
Technically, the daily chart MACD red bars have begun to shrink, DIF is converging towards DEA, and bullish momentum is fading as the market enters a consolidation phase at the highs.
The 4-hour chart has already formed a death cross, with short-term bearish strength starting to release, but this is better defined as a post-rally pullback correction rather than a major trend reversal.
RSI is around 56.6, still in a neutral to slightly strong zone, so there remains headroom for another test of resistance above.
The key risk to watch for is: **BTC suddenly weakening + ETH/BTC rate dropping at the same time.** If both happen together, ETH's downward elasticity could sharply expand.
Support: 2,485-2,500; 2,466
Resistance: 2,550-2,563; 2,580-2,610; 2,660