Stellar [XLM] is up 8.2% in 24 hours. Per CoinMarketCap data at the time of writing, its daily trading volume has spiked by 221%.
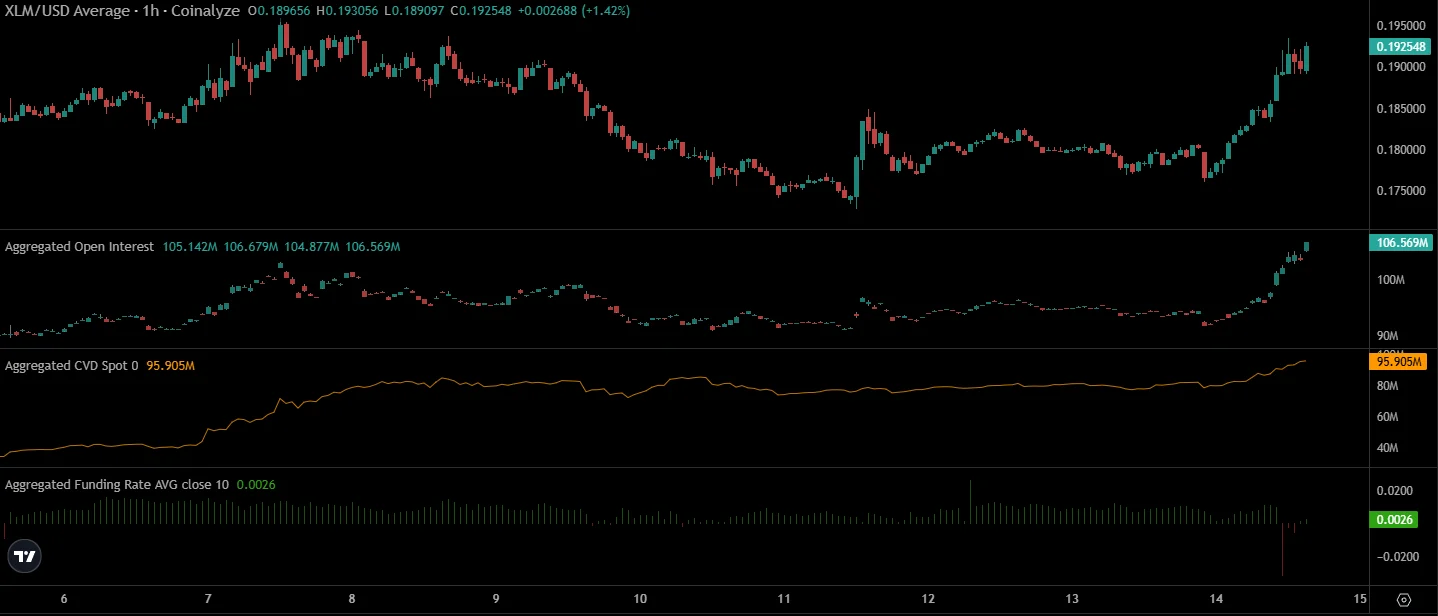
The strong volume was accompanied by a 14.4% surge in Open Interest in 24 hours. Moreover, the spot CVD has also been rising in recent hours. The funding rate briefly dipped into negative territory, Coinalyze data showed.
This dip did not halt the bullish momentum of the XLM price. It only showed that market participants tried to go short at the local resistance level at $0.184 and got their fingers burnt for trying.
In a recent report, AMBCrypto highlighted the altcoin’s bearish long-term trend. Here’s how the XLM price trends are shaping up after the recent gains.
XLM price defends $0.173 support…for now
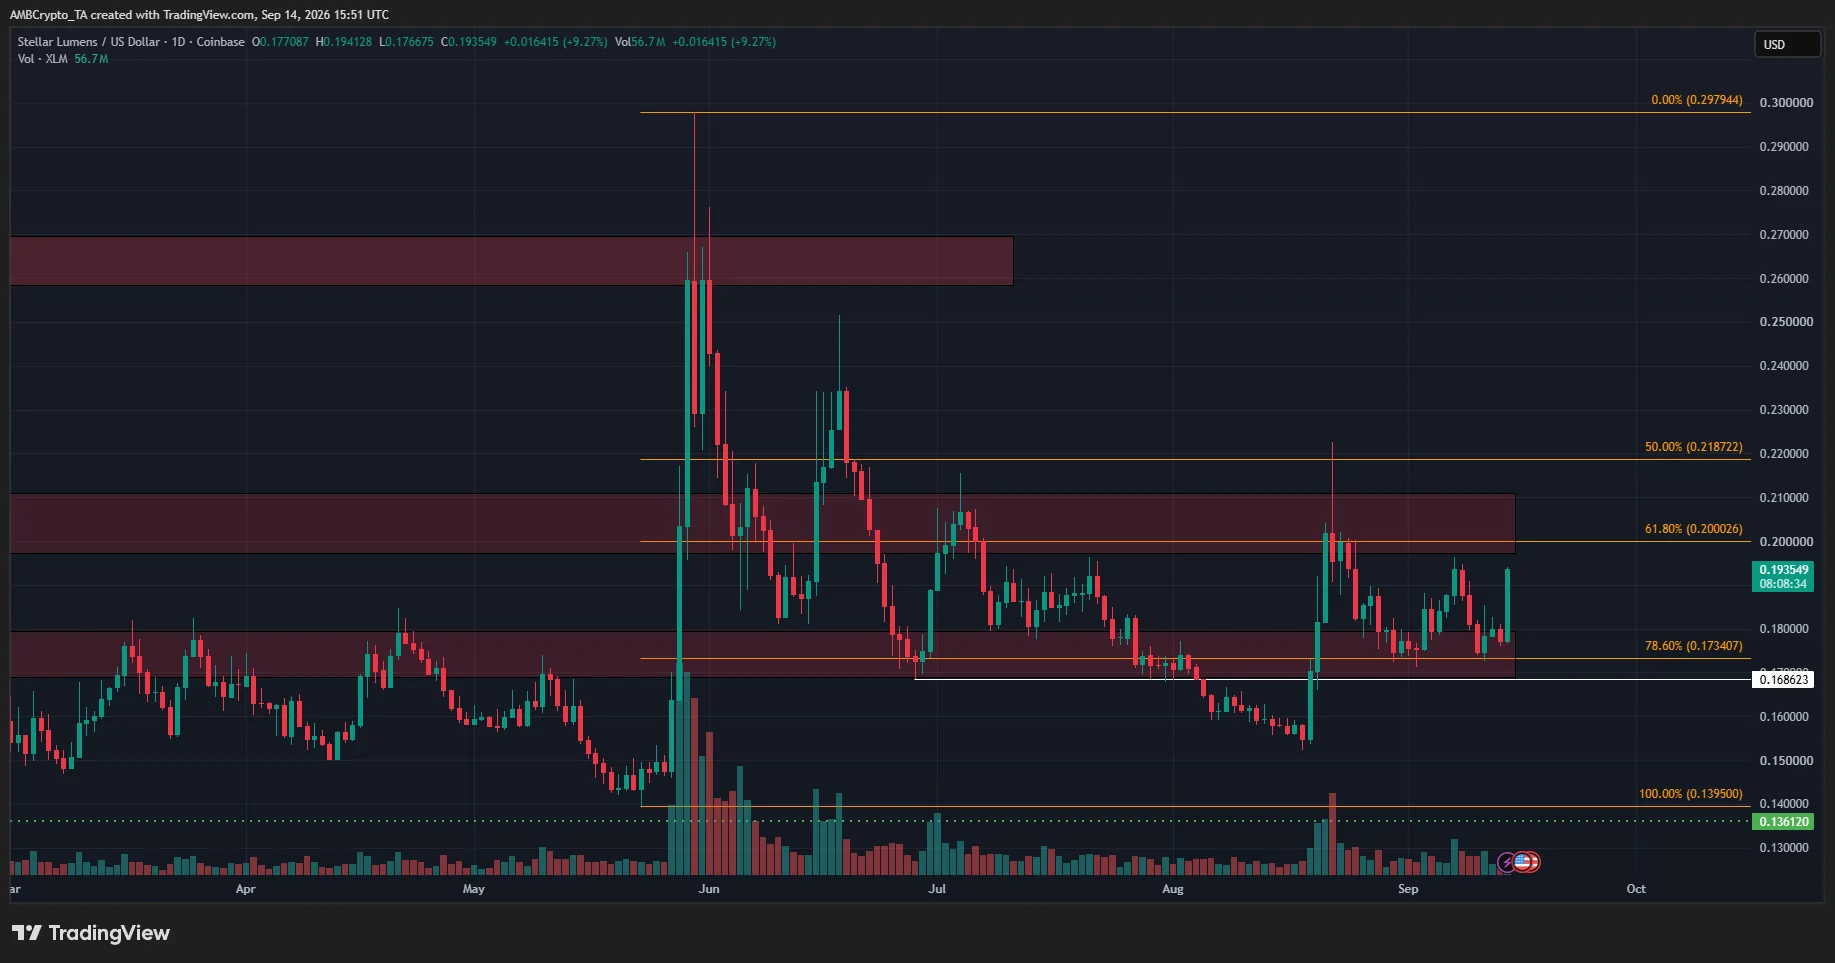
The swing structure on the 1-day timeframe was bullish. The Fibonacci retracement levels [orange] showed that $0.173 was the 78.6% retracement level. It has been tested over the past two weeks, and buyers have defended it well in September.
$0.20 was the next local resistance zone to watch, and that was where the XLM price was headed next.
The $0.17 and $0.20 areas, demarcated in red, are the key supply/demand zones to watch. The altcoin has reacted from these areas since June.
Traders’ call to action- Wait for a breakout
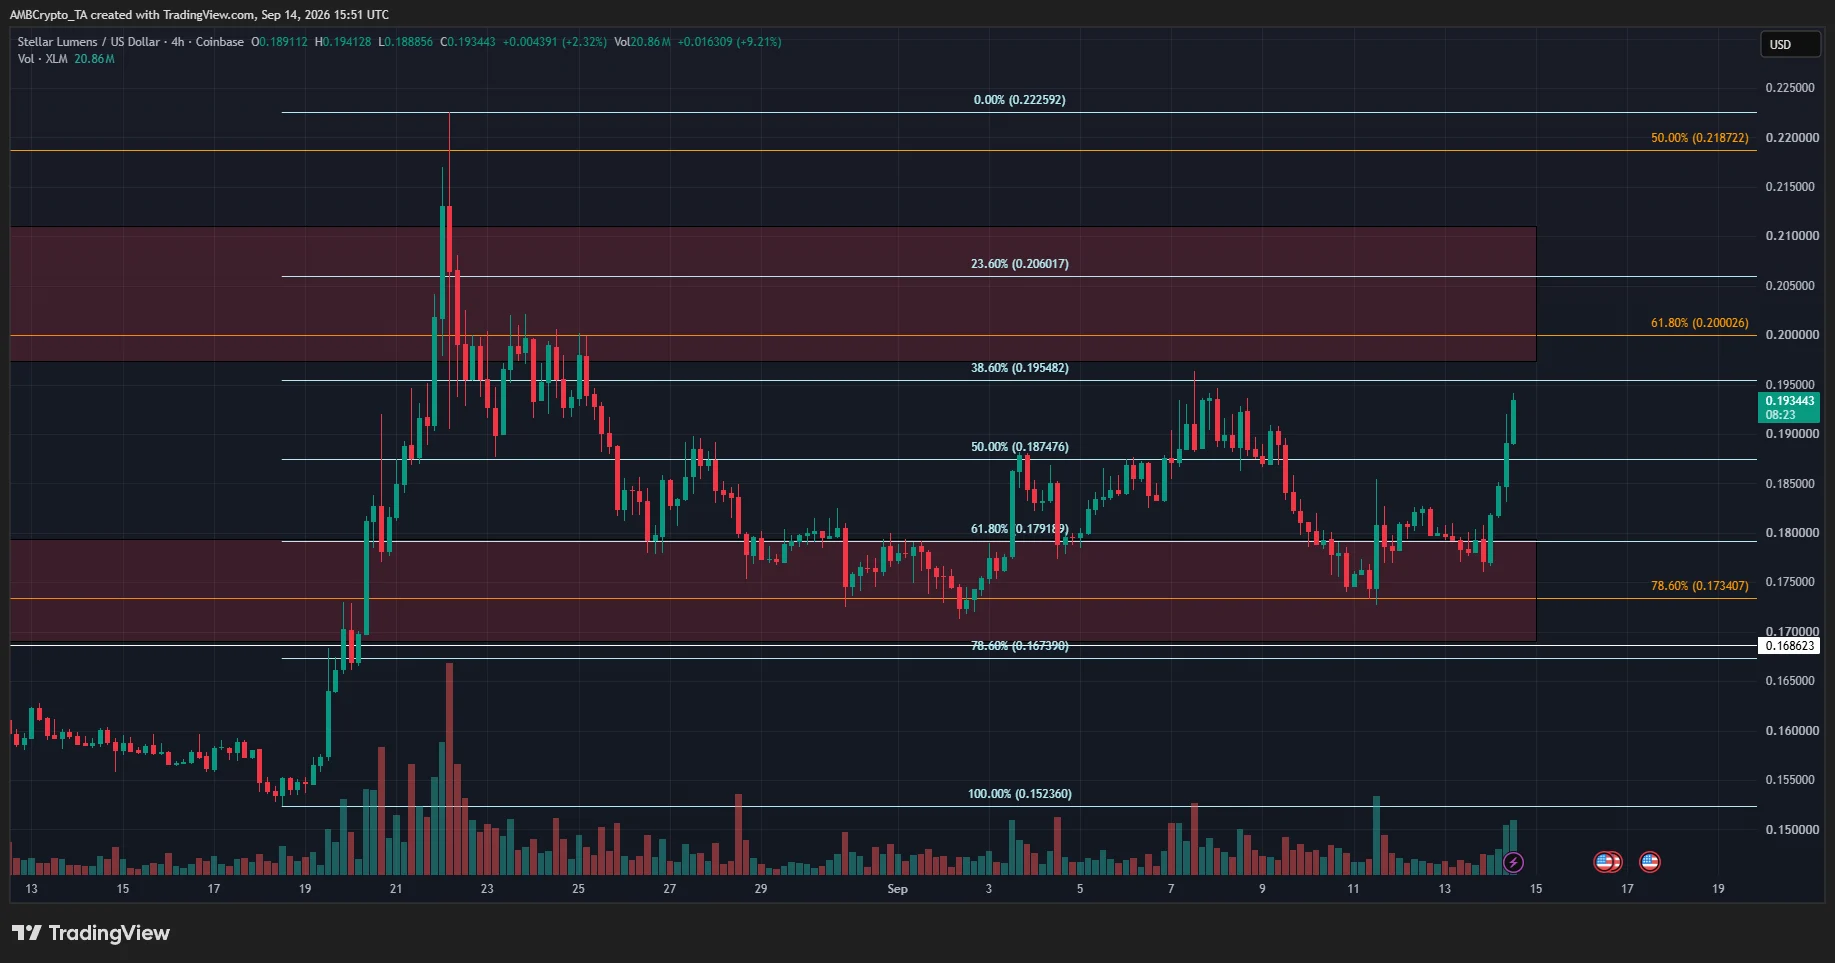
Despite the strong bullish momentum to start Monday, the XLM price was still within a local range from $0.173-$0.195. The H4 swing structure may be bullish, but the $0.195 supply zone must be overcome to keep the uptrend going.
Even if it is, as we saw earlier, the $0.20-$0.21 area is another resistance zone to watch.
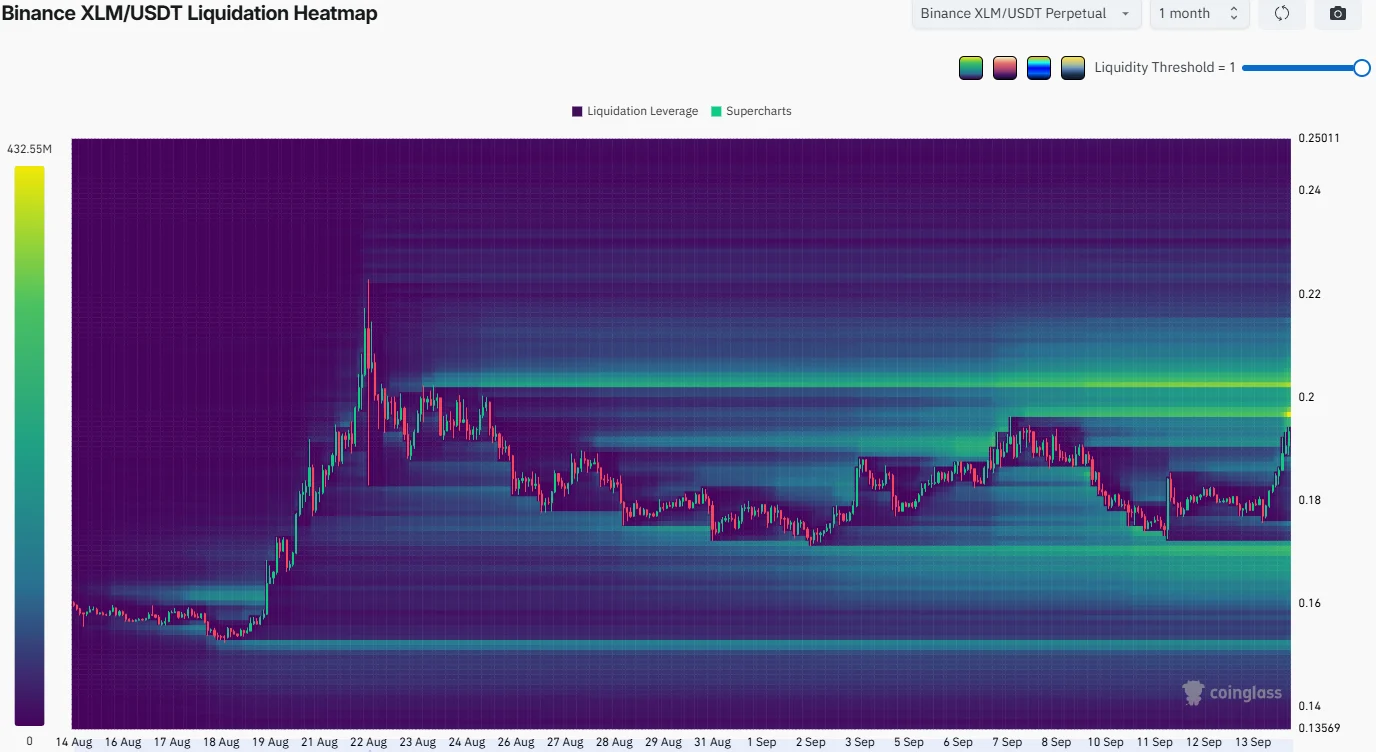
The liquidation heatmap highlighted the importance of the $0.20 area as a magnetic zone. Given the bullish momentum, the token is highly likely to test this supply zone.
A bullish breakout past this area depends on strong demand in the spot and derivatives markets. A lack of demand and a swift price surge into this area could be a liquidity hunt before a trend reversal and a price dip back toward $0.17.
Final Summary
- The XLM price trend was firmly bullish in the past 24 hours.
- The higher timeframe trend for the year was bearish, and even in recent weeks, the $0.20 supply zone has been a stern obstacle to the buyers.