
Cloudflare stock surges 9.25% after OpenAI tie-up, but overbought signals flash

Cloudflare stock surged 6.32% after announcing a security partnership with OpenAI. NET opened at 295.50, hit 317.55, and closed at 314.18 — its sharpest single-day move in months. The bullish daily structure now faces a critical test.
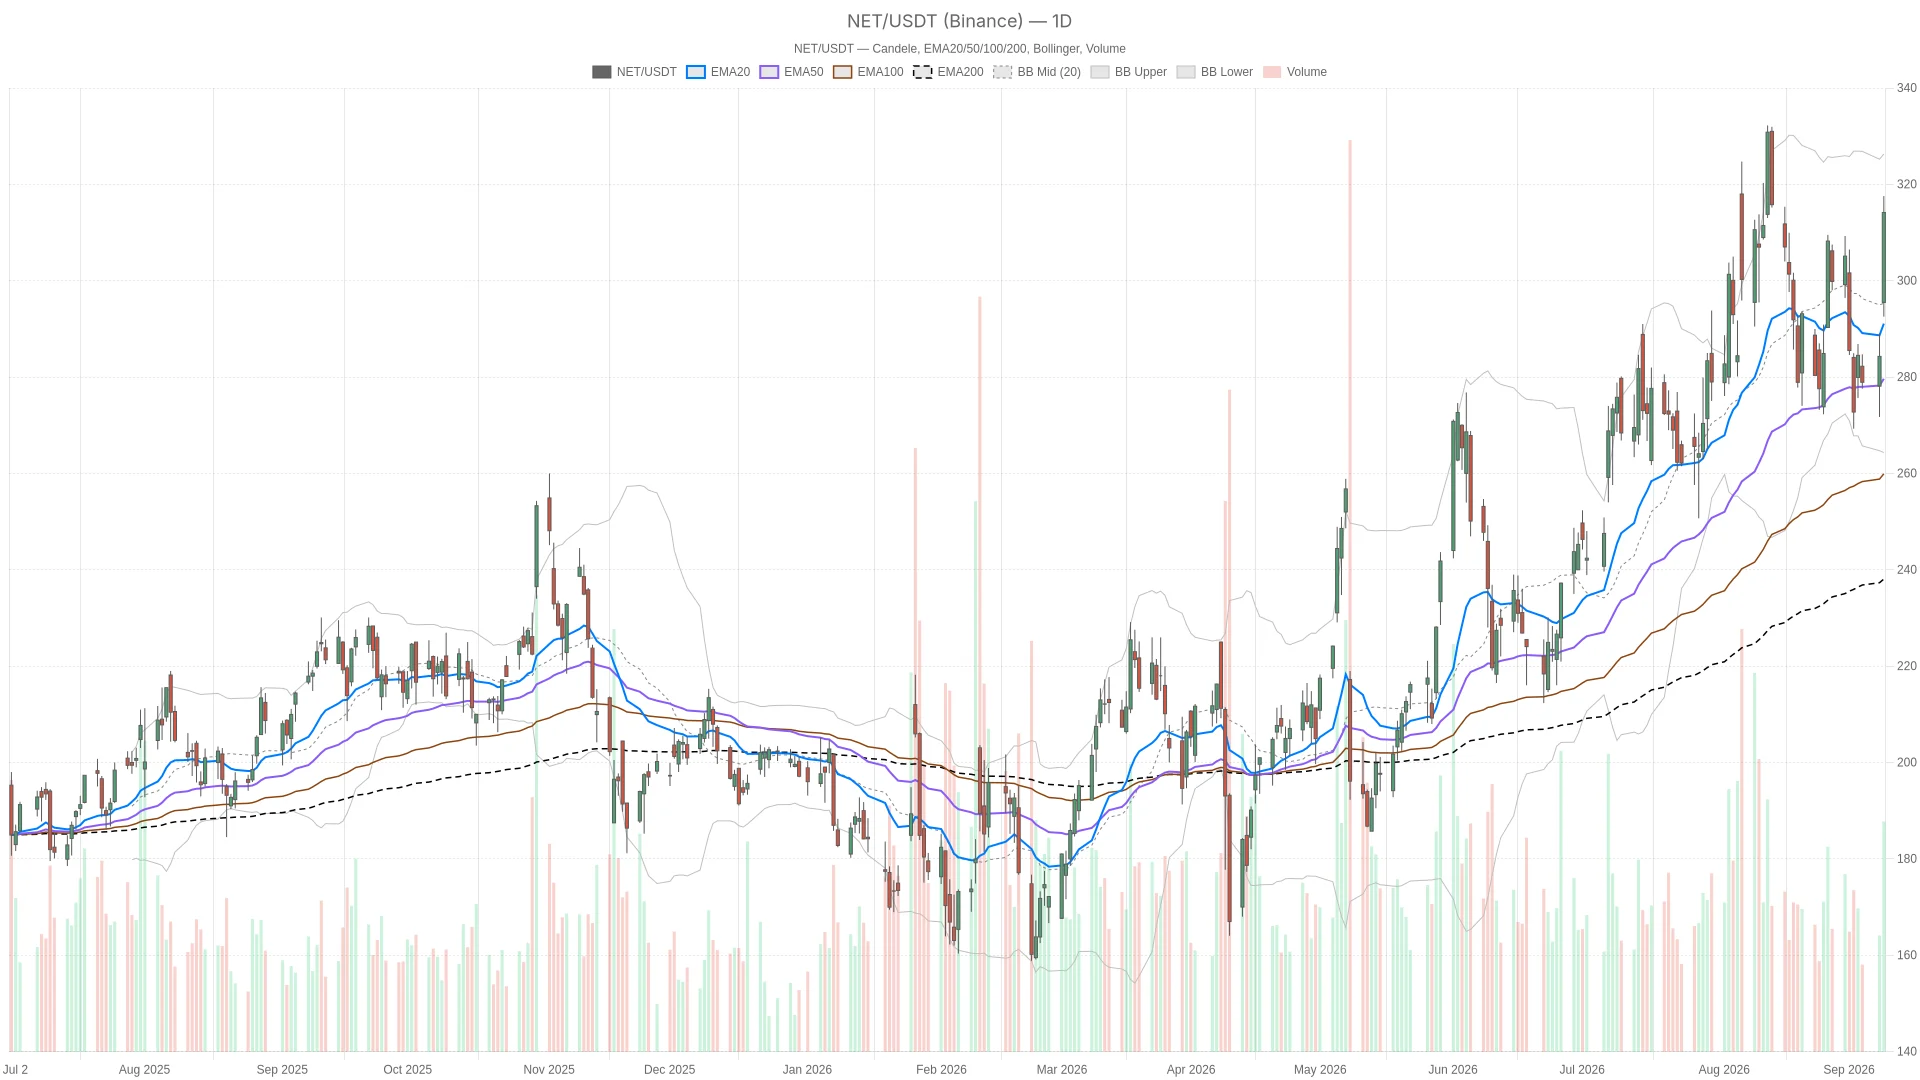 NET — daily chart with candlesticks, EMA20/EMA50 and volume.
Summary
Key takeaways
- Cloudflare stock jumped 9.25% following the OpenAI security partnership announcement.
- Daily structure remains bullish with price above EMA20 (291.10), EMA50 (279.65), and EMA200 (238.08).
- Daily RSI14 at 58.58 leaves room for further upside before overbought conditions emerge.
- 1H RSI14 at 76.63 signals overbought conditions, raising near-term pullback risk.
- Insider selling: President Michelle Zatlyn sold $27.6 million in stock around the same period.
Daily Trend and Momentum Structure for Cloudflare Stock
The daily trend for Cloudflare stock remains firmly bullish, but momentum indicators have not yet fully confirmed the breakout’s strength. The stacked alignment of moving averages tells a clear story.
Trend Alignment Remains Bullish
Price sits comfortably above the EMA20 at 291.10, the EMA50 at 279.65, and the EMA200 at 238.08. This arrangement — shorter-term averages above longer-term ones, all rising — is a textbook uptrend signature. The daily regime reading confirms the bullish structure outright.
RSI14 on the daily chart sits at 58.58. This is a healthy, moderate reading. It sits nowhere near overbought territory despite the rally’s size. Consequently, there is still room for the trend to extend before momentum becomes stretched on this timeframe.
Momentum Gap Emerges on MACD
However, the MACD tells a slightly different story. The line sits at 2.20 against a signal of 2.85, producing a negative histogram of -0.65. In plain terms, daily momentum has not yet caught up with the price action.
This is not necessarily bearish. It often happens after a sharp one-day surge, since MACD lags price by design. Still, the nuance is worth watching. The daily trend remains intact but has not fully confirmed the breakout’s strength yet.
Meanwhile, volatility has clearly expanded. The ATR14 on the daily stands at 16.94. Price now presses toward the upper Bollinger Band at 326.30, well above the mid-band at 295.33. The lower band sits at 264.35. That spread illustrates how much the range has widened following the OpenAI-driven surge.
Daily Pivot Levels and the Path Ahead
The daily pivot levels define the near-term battleground for Cloudflare stock. The central pivot sits at 308.09. Resistance stands at R1 323.64, while support holds at S1 298.63.
NET’s close at 314.18 is comfortably above the pivot, keeping buyers in control for now. A move through 323.64 would open the door to further upside continuation. On the other hand, a slide back below 298.63 would put the recent breakout under real pressure.
1H Timeframe Confirms the Trend But Runs Hot
The 1-hour chart reinforces the bullish case — perhaps too aggressively. EMA20 at 298.17, EMA50 at 292.29, and EMA200 at 290.29 are all stacked bullishly. The regime reading again confirms a bullish structure.
Notably, RSI14 on the 1H sits at 76.63. That is firmly overbought. Combined with a MACD line of 8.18 against a signal of 4.85, the short-term momentum is running hot. The histogram is strongly positive at 3.33.
This confirms the daily uptrend in direction. However, it also raises the risk of a near-term cooling-off period. Overbought conditions on this scale rarely extend in a straight line.
Additionally, the 1H ATR14 reads 5.53. Price trades near the upper Bollinger Band of 322.01, versus a mid-band of 292.85. That gap underscores how extended the intraday move has become relative to its own short-term average.
15-Minute Chart Shows Early Consolidation
The 15-minute chart presents a more nuanced picture. The trend remains structurally bullish, but early signs of consolidation are emerging.
EMA20 at 311.47, EMA50 at 302.25, and EMA200 at 291.42 remain bullishly aligned. The close at 314.28 sits above all three. RSI14 at 65.98 is elevated but not extreme.
At the same time, the MACD histogram here is negative at -0.98. The line at 4.46 sits below the signal at 5.44. This mirrors the lagging-momentum dynamic seen on the daily chart. It hints at a short-term pause or consolidation after the initial spike.
The Bollinger Bands have also tightened. The upper band sits at 317.80 and the lower band at 308.73. This narrower range is consistent with short-term digestion of the move. For traders using this timeframe for entry timing, the tightening range suggests waiting for a clearer break of either the 315.94 or 312.46 pivot levels before committing.
Bullish vs Bearish: Two Paths for Cloudflare Stock
The Bullish Scenario
If Cloudflare stock can hold above the daily EMA20 near 291 and clear R1 at 323.64, the uptrend has room to extend. Supporting evidence already exists in the news flow. Options activity has shown bullish conviction around the 9.25% surge.
The OpenAI security partnership gives the rally a fundamental anchor rather than pure momentum. Additional coverage has pointed to Meta’s new Muse agent as a potential driver of increased web traffic. This could feed directly into Cloudflare’s revenue base.
Furthermore, Cloudflare’s presentation at the Goldman Sachs Communacopia + Technology Conference this week keeps the company in the spotlight. A continuation higher would need the 1H RSI to cool from its overbought reading without breaking trend structure — a healthy pullback rather than a reversal.
The Bearish Scenario
In contrast, the bearish case rests on a failure to hold recent gains. A break below daily S1 at 298.63 would suggest the rally is losing steam. A retreat toward the Bollinger mid-band at 295.33 and the EMA20 at 291.10 would reinforce that concern.
The negative daily MACD histogram, if it persists or widens, would add weight to the bearish argument. On the sentiment side, Cloudflare president Michelle Zatlyn sold $27.6 million in stock around the same period. This does not necessarily signal distrust in the company. However, it adds a layer of caution for those watching insider behavior alongside the technical picture.
A drop through the 1H EMA50 at 292.29 would be an early warning. It would indicate that short-term momentum has genuinely broken down, not just cooled.
Overall, Cloudflare stock enters this phase with a bullish daily structure freshly reinforced by a major news catalyst. However, short-term momentum on the 1H timeframe is running into overbought territory. The daily MACD has not fully confirmed the move’s strength yet. The 15-minute chart shows early signs of consolidation after the spike. Therefore, positioning around NET right now requires balancing the trend’s strength against elevated volatility. ATR readings across all three timeframes point to wider-than-usual price swings ahead. Some near-term chop or pullback would not be surprising — even within an intact uptrend.
FAQ
What drove Cloudflare stock’s sharp rally?
A security partnership with OpenAI triggered the surge. NET jumped 6.32%, opening at 295.50 and closing at 314.18 — its sharpest single-day move in months.
Is Cloudflare stock overbought after the rally?
On the daily timeframe, RSI14 at 58.58 remains moderate and healthy. However, the 1H RSI14 at 76.63 is firmly overbought, suggesting near-term cooling is possible despite the intact uptrend.
What are the key levels to watch for Cloudflare stock?
Daily R1 at 323.64 is the immediate upside target. Support sits at S1 298.63, with further cushion at the Bollinger mid-band of 295.33 and the EMA20 at 291.10.
Does insider selling affect the Cloudflare stock outlook?
President Michelle Zatlyn sold $27.6 million in stock around the same period. It does not necessarily signal distrust, but it adds caution for those monitoring insider activity alongside technicals.
Article produced with the assistance of artificial intelligence and reviewed by the editorial team.
Disclaimer: The content of this article solely reflects the author's opinion and does not represent the platform in any capacity. This article is not intended to serve as a reference for making investment decisions.
You may also like
Zcash (ZEC) Prints TD Sequential ‘9’ Sell Signal — Last Time It Appeared, Price Fell 64%
Why Is VTHO Up 38.57% in 24 Hours? Extreme Funding Rate and Liquidation Data Explained

India’s $2B Agricultural Credit Network Moves Onchain via Avalanche and Arya.ag

Crypto prices
More


