Ethereum [ETH] had a solidly bullish August. The monthly low and high were at $1,820 and $2,567, respectively, a 41% rally. The steady gains were accompanied by a streak of positive flows into Spot Ethereum ETFS.
Since the 12th of August, Farside Investors’ data showed a net flow of $1.736 billion into spot ETFs. Except for the 2nd of September, every trading day has seen inflows.
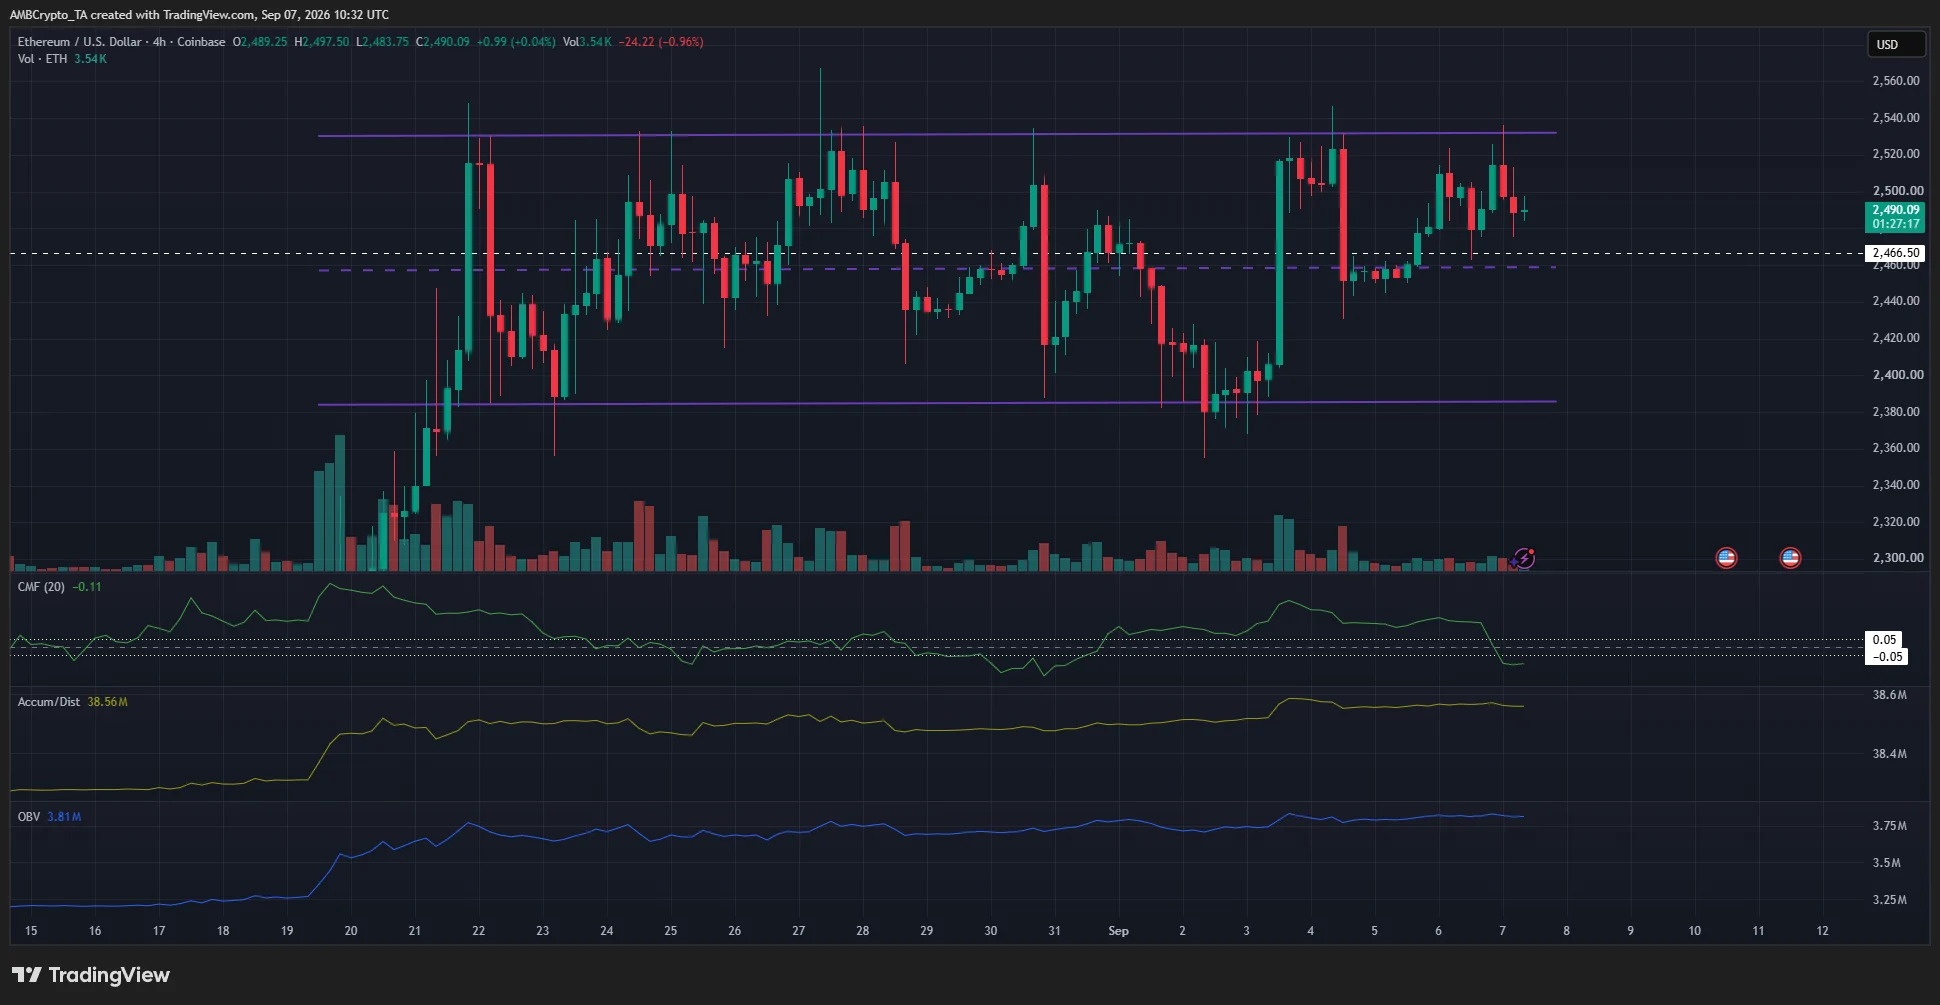
Yet, the bullish Ethereum momentum has stalled in recent weeks. The 4-hour chart above highlights a range formation (purple) between $2,380 and $2,530.
Moreover, the swing high at $2,466 from April, which marked a lower high in the long-term downtrend from last October, is within this range.
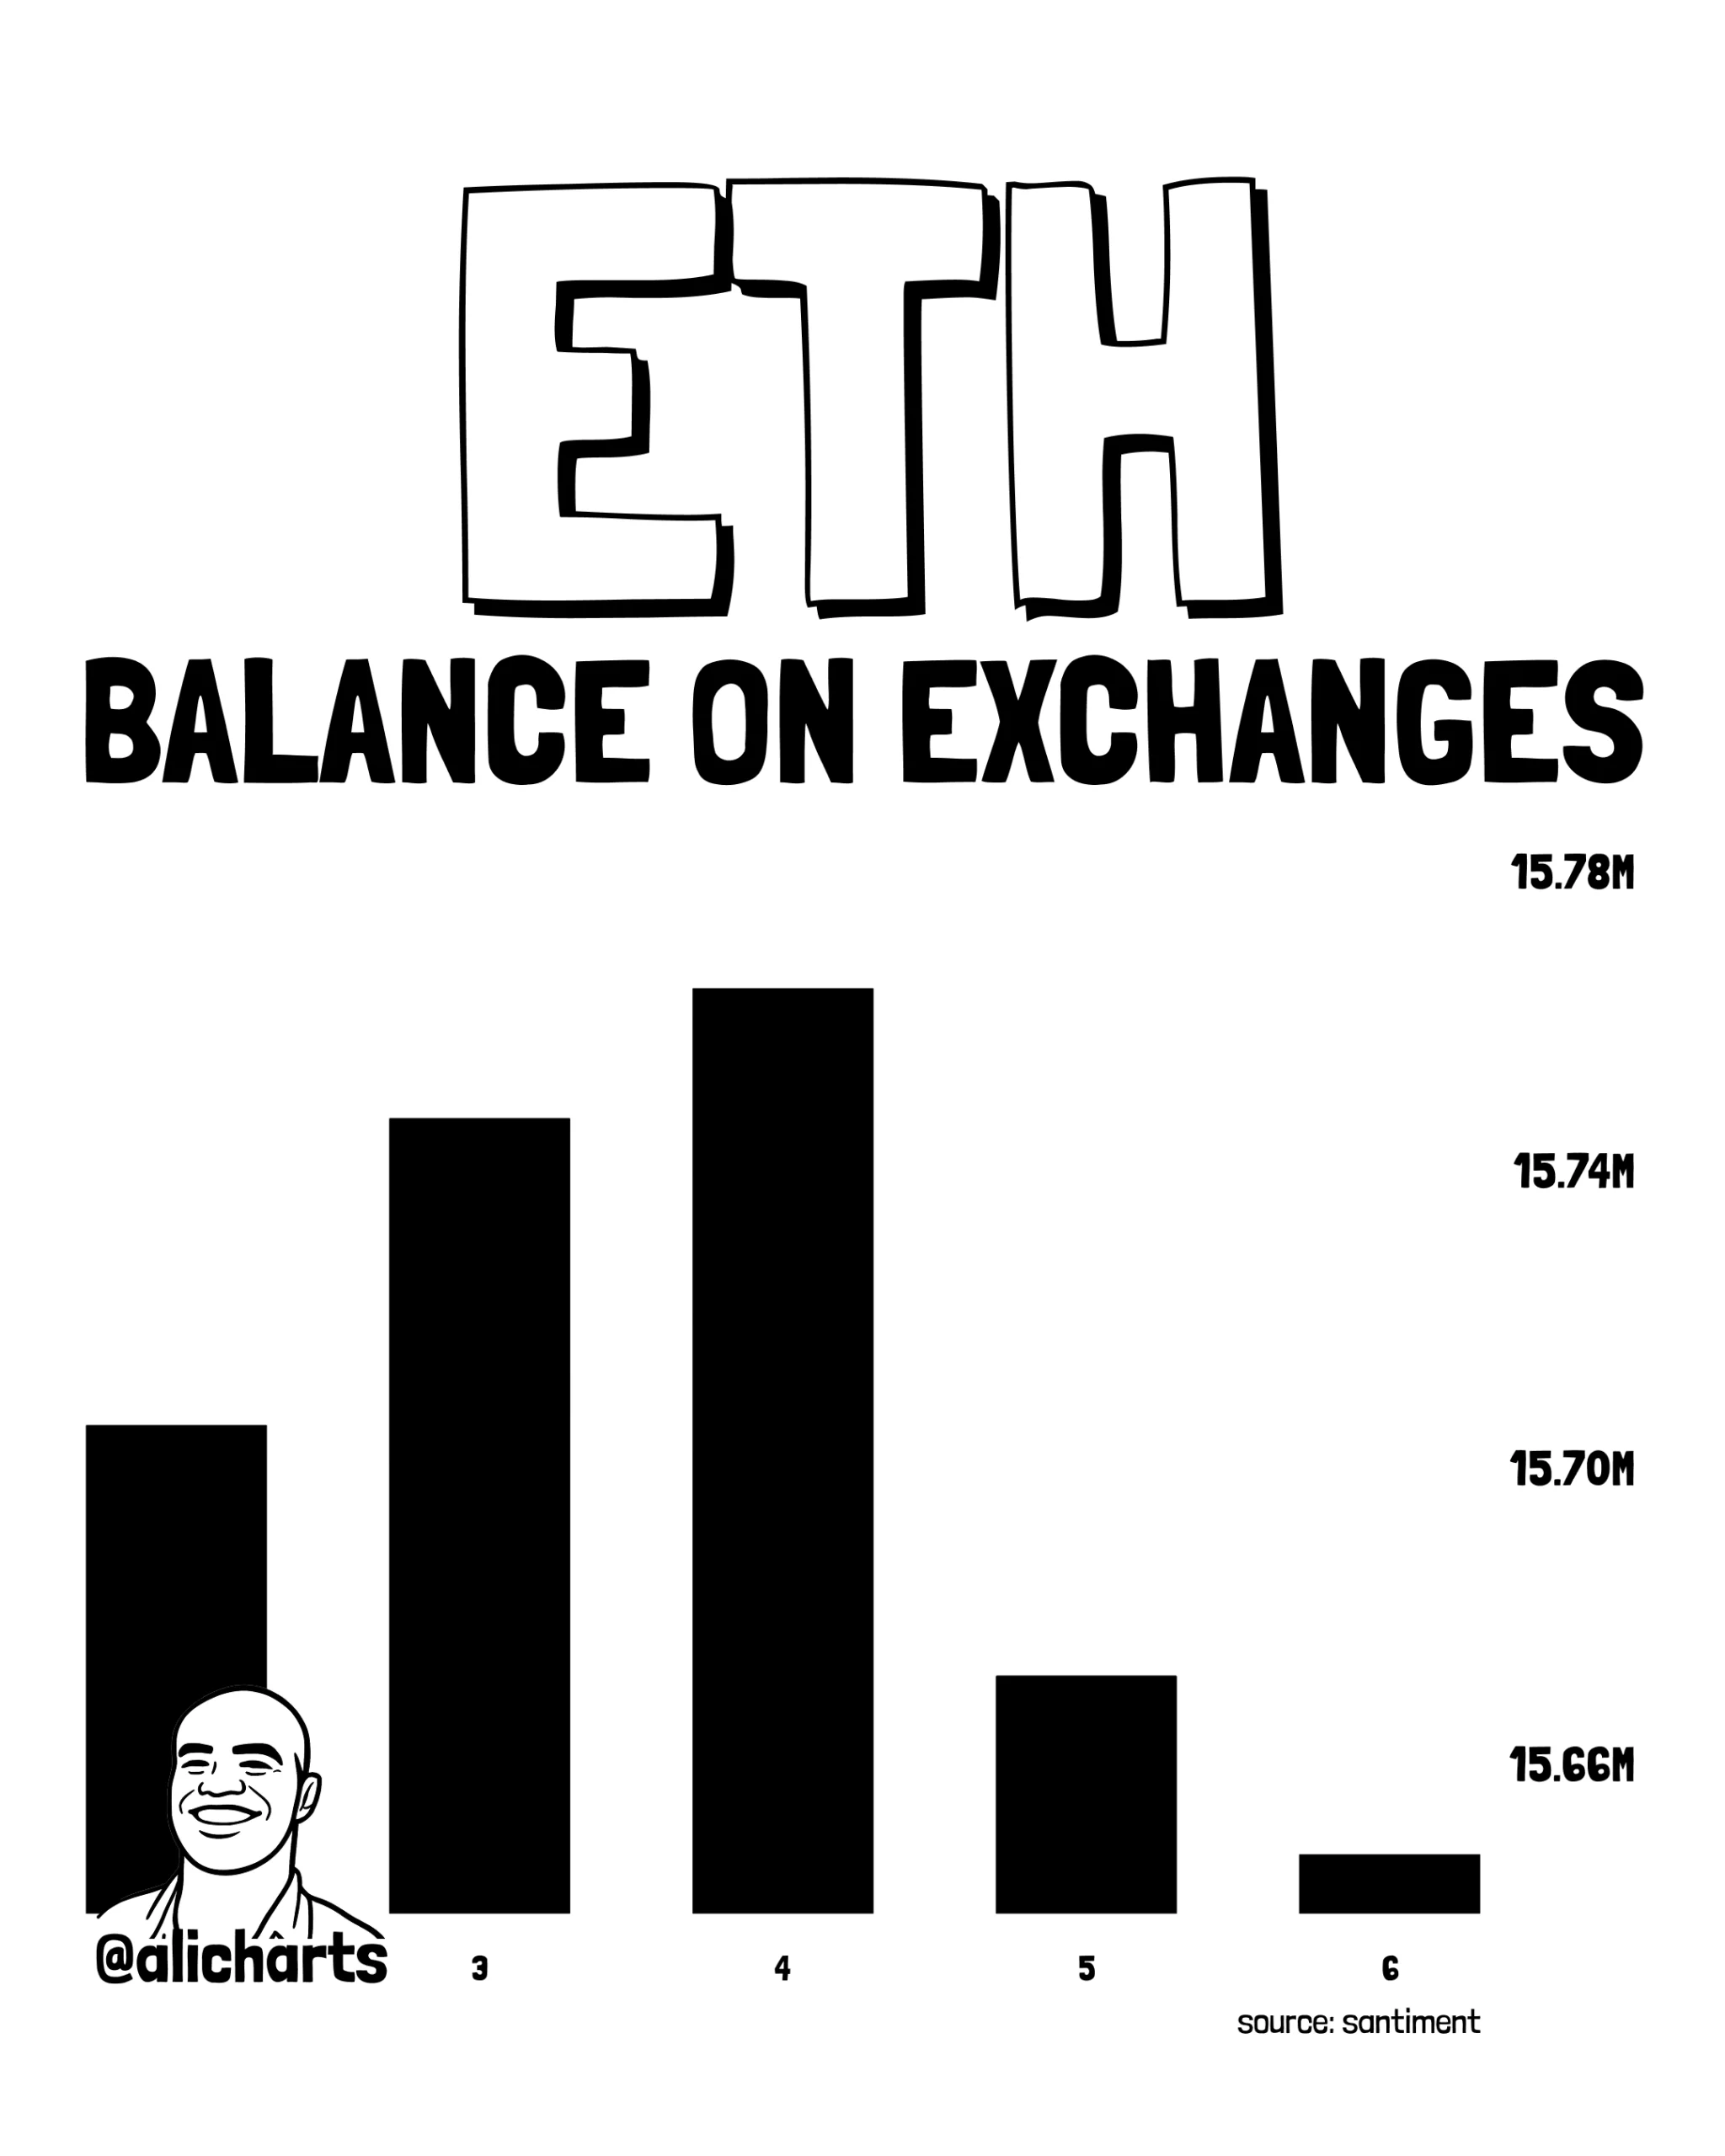
In other words, there is a chance that ETH is facing distribution at a key swing level. The 4-hour timeframe’s volume indicators don’t show steady selling, but there is some doubt among investors.
Resolving the short-term Ethereum range
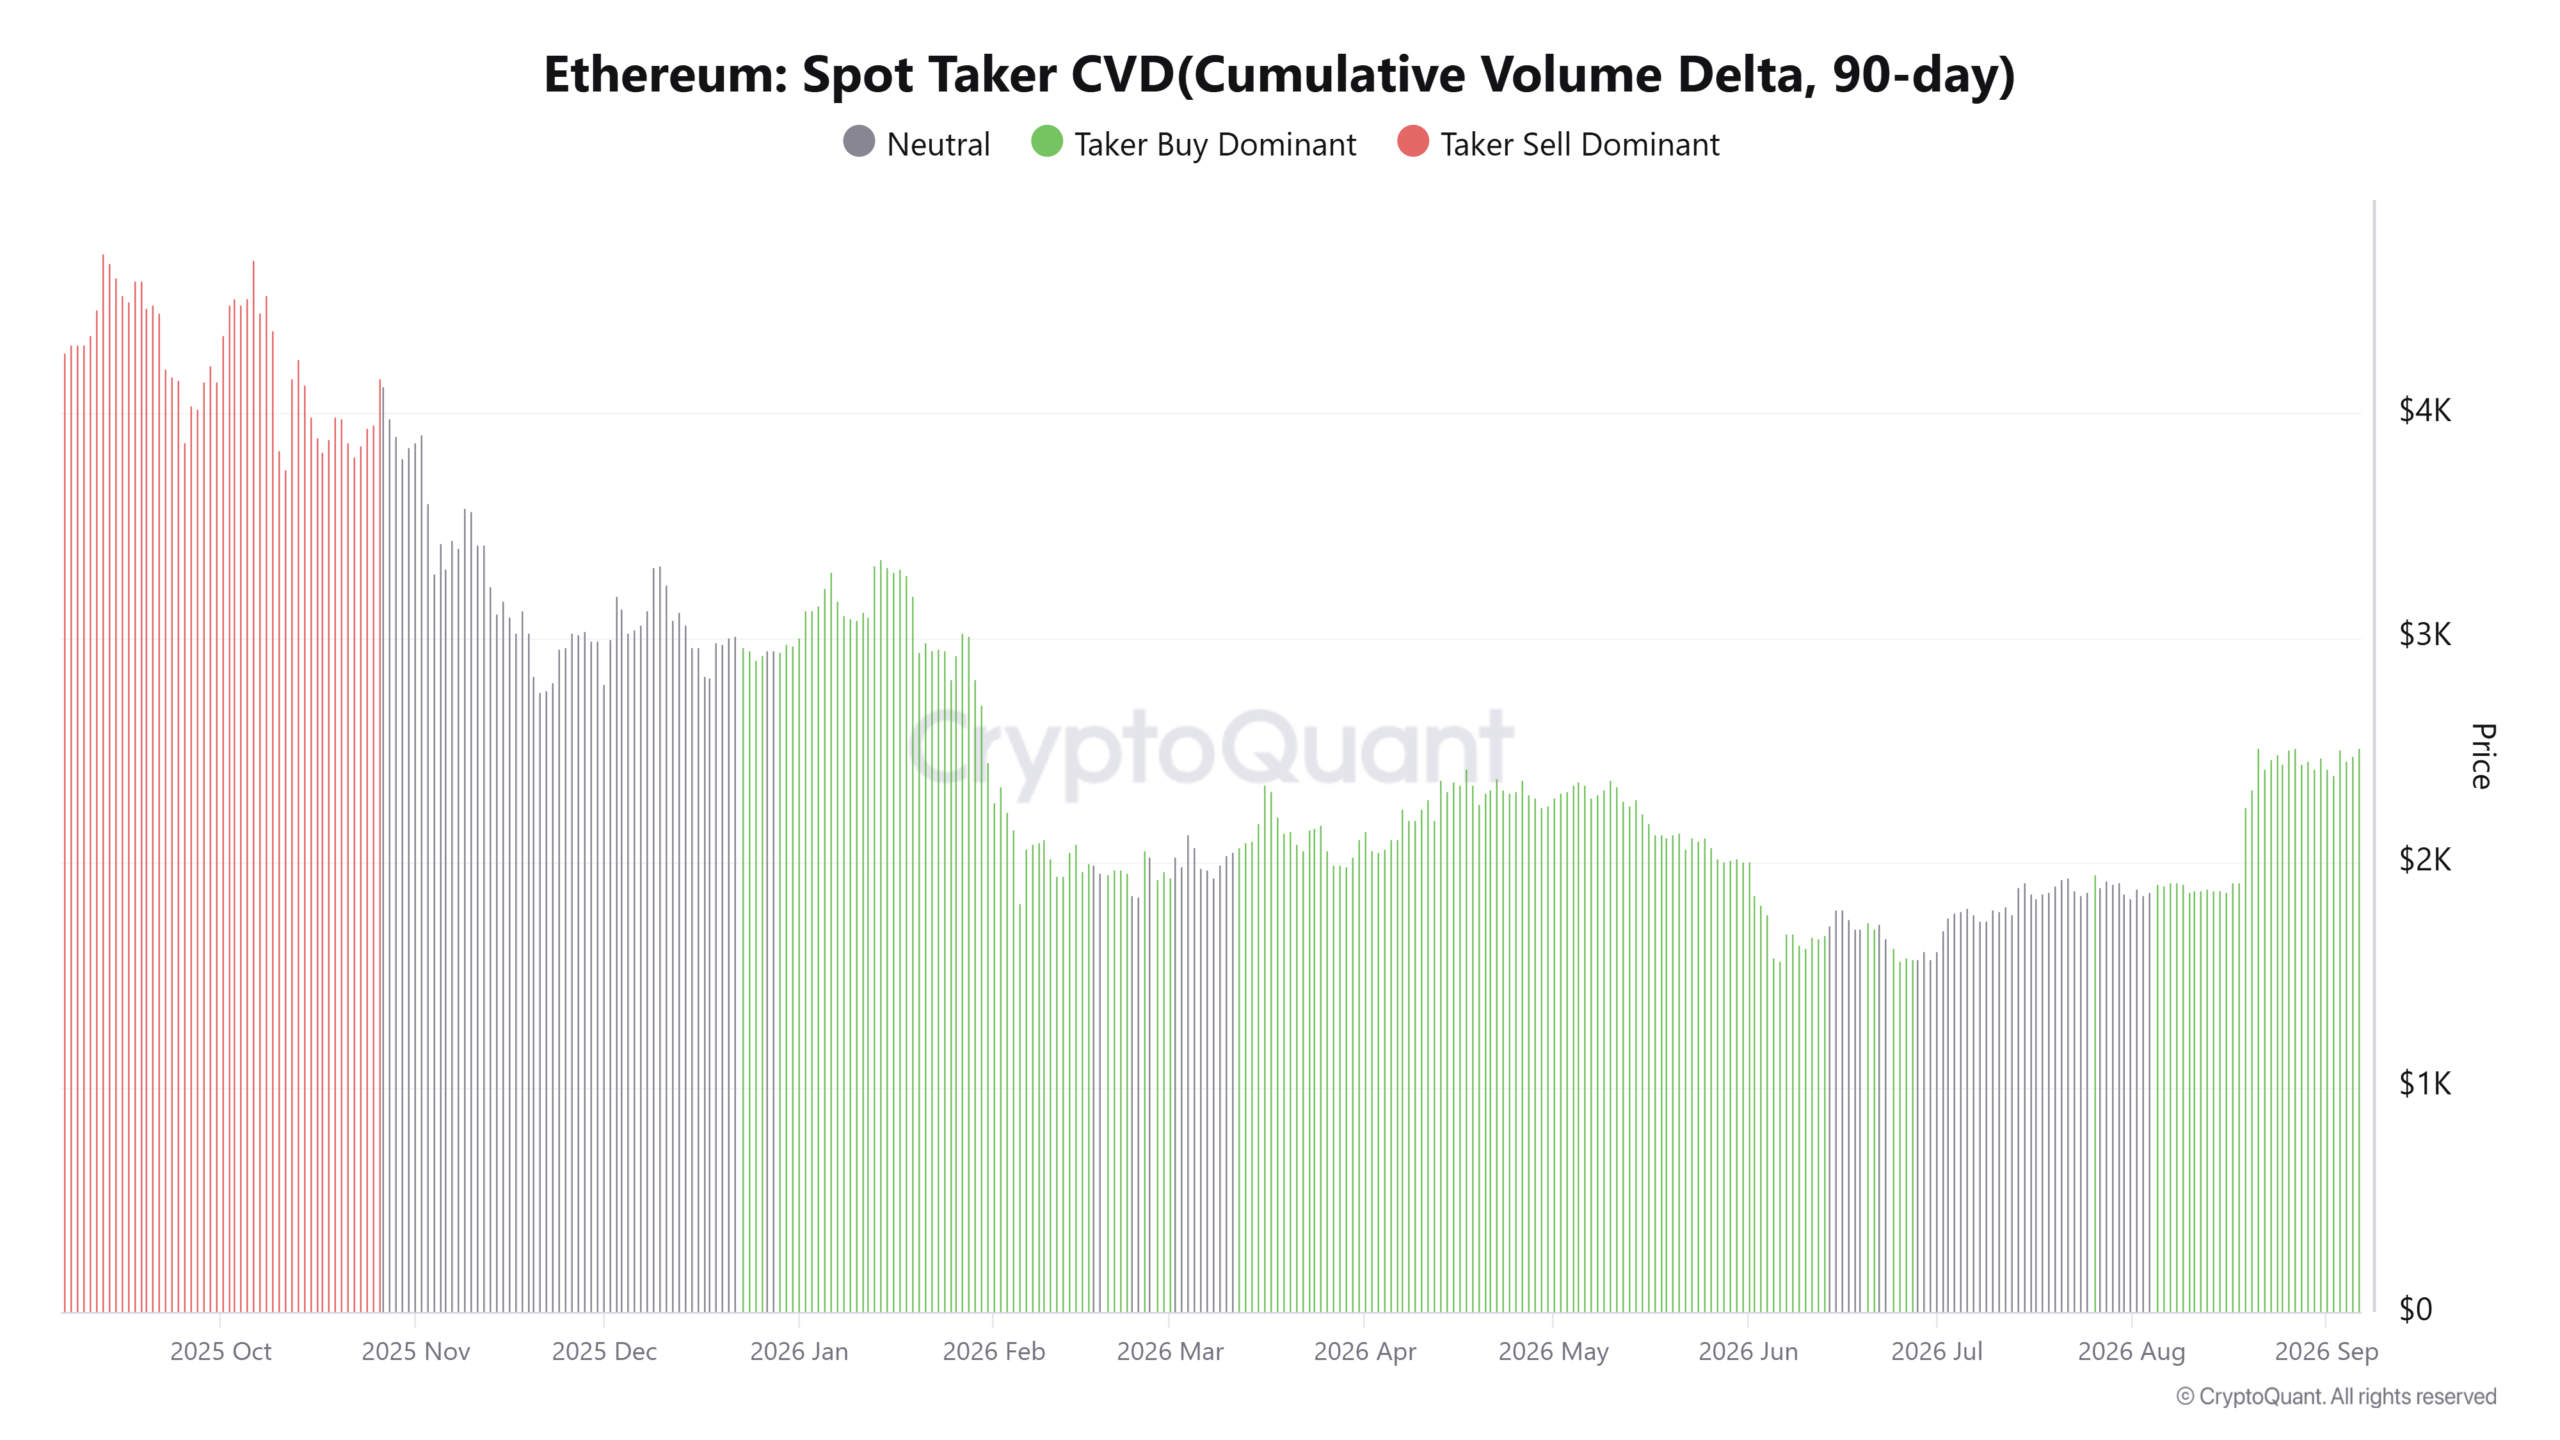
The 3-month taker CVD measured an increase in aggressive buying volume in August. Currently, the Spot taker CVD reflects taker-buy-dominant conditions, which indicates notable buying pressure.
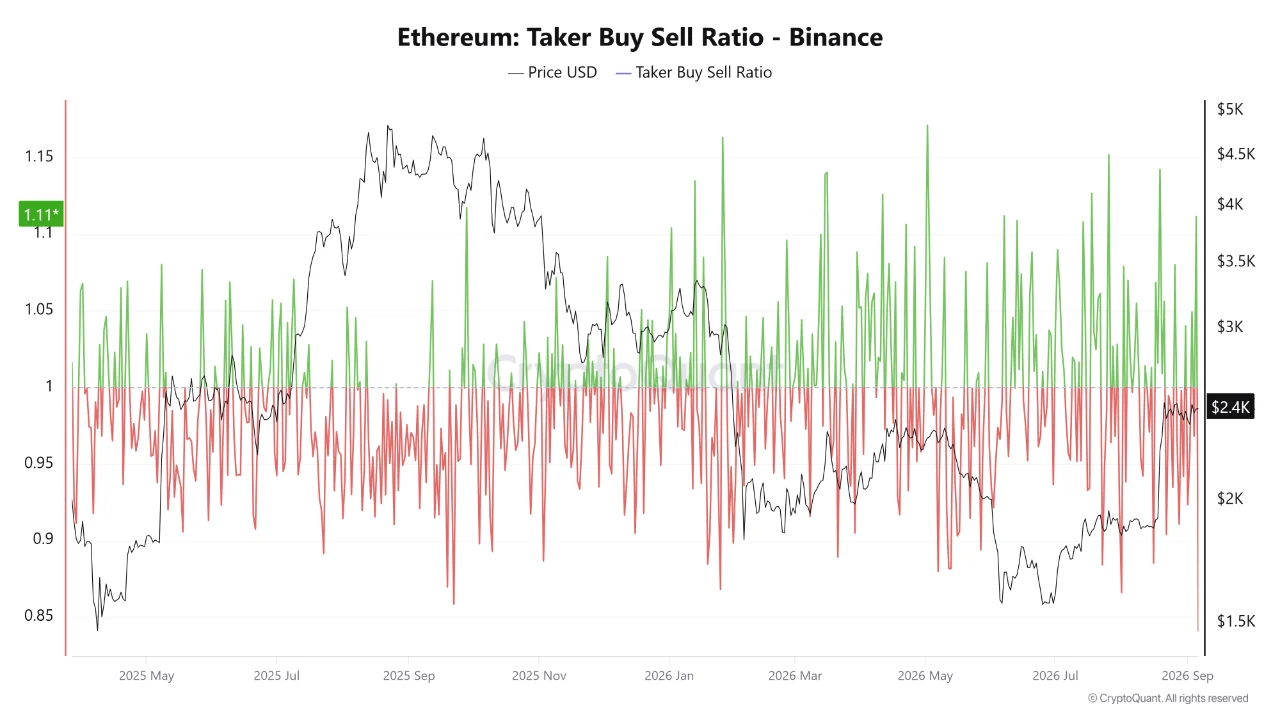
The derivatives markets also saw an uptick in buying pressure. The taker buy/sell ratio climbed to 1.11. Readings above 1 reflect that aggressive (taker) buy orders outweighed sellers and signal buyer dominance.
If the ratio remains above 1 in the coming days, it will reflect elevated, sustained buy pressure. This could help drive Ethereum prices beyond the pivotal $2.5k resistance area.
Evidence signals an “imminent bullish breakout”
Aggressive accumulation and Spot and derivatives taker buyer dominance pointed toward firm bullishness in the market.
It seemed to be only a matter of time before the $2,530 range high was broken. In that scenario, the next long-term resistance to watch out for would be the $2,900-$3,000 supply zone.
Meanwhile, a breakdown below $2,380 would be the first notable signal that things were starting to go against the ETH bulls.
Final Summary
- Ethereum has formed a range around the $2.5k resistance, right by the $2,466 high from April, a key level in the long-term downtrend.
- In the short-term, heavy Spot and derivatives demand suggested buyers had the upper hand, and a bullish ETH breakout was likely.