
Nobody has unwound the Japanese Yen carry trade yet

The Ministry of Finance was not in the market on Monday, and on the most recent positioning data the carry trade did not close either. USD/JPY trades just above 154.00 after giving up close to two Yen, its weakest in six months. What has repriced is the cost of the funding leg. The position that leg supports is still open.
Tokyo had the window and did not need it
American markets are shut for Labor Day, the thin-liquidity Monday that Tokyo has historically preferred for its operations. The move arrived without them. USD/JPY gave up roughly a Yen and a half between 08:00 GMT and 08:40 GMT, and the bounce that followed recovered less than half of it. The July 31 joint operation moved the pair several Yen inside minutes. This one took forty.
The mechanics point the same way. Japan buys Yen when the Yen is weak, and the joint statement signed with the United States Treasury in September 2025 is written against disorderly weakness rather than strength. Tokyo spent ¥15.4 trillion, roughly $98 billion, buying its own currency between July 30 and August 26, when the Yen sat at four-decade lows. It is about ten Yen stronger than that now, and no official on either side has claimed Monday's move.
The position got bigger in the week before the rally
Speculators were still adding to Yen shorts on September 1. Commodity Futures Trading Commission (CFTC) data released Friday show non-commercial net shorts widening by 28.9K contracts to 92.2K over that reporting week, the largest deterioration in the report. USD/JPY has since fallen roughly six Yen from the September 2 high just above 160.00. The book that is supposed to have caused the move was still being built at the top of it.
An unwind looks different across the tape. Leverage coming off sells the highest-beta positions first, so the Yen crosses lead, equity volatility rises and the commodity currencies go with them. AUD/USD instead sits near its highest since mid-May and Gold holds close to $4,400. This is a repricing of what Yen funding will cost, not a liquidation of what it funds.
Both banks hike and the gap ends where it started
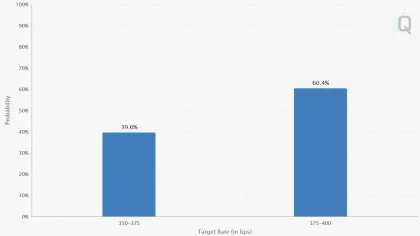
Tokyo's policy rate is 1% and the target range in Washington is 3.50% to 3.75%. Swaps put a quarter point from the Bank of Japan (BoJ) on September 18 at close to 97%, and fed funds futures put a quarter point from the Federal Reserve on September 16 at 58% after Friday's payrolls. Deliver both and the differential moves from roughly 2.6 percentage points to roughly 2.6 percentage points.
So this is not a trade about the level of the gap. It is a trade about the path, and the path repriced because the domestic case against it gave way. A BoJ board member argued last week that 2026 marks a change of phase and that consecutive moves are possible, which would break a cadence of roughly one hike every six months.
The Prime Minister's own economic adviser, until recently the loudest opponent of tightening in her circle, now expects a hike this month and another by January, and warns that the faster pace could weigh on the economy. The ten-year Japanese Government Bond (JGB) yield cleared 3% on September 1 for the first time since 1996, and two-year yields are at their highest since 1995. Japan imports nearly all of the Crude Oil driving those numbers, and the war that prices it has been running since February.
The week's prints are all on the American side
Japan reports first. Labour cash earnings for July land at 23:30 GMT Monday with a 3.9% YoY consensus after 3.4%, followed at 23:50 GMT by the current account, seen at ¥2.87 trillion after a ¥92.3 billion deficit, and the second estimate of second-quarter Gross Domestic Product (GDP), seen at 0.4% on the quarter against 0.3% and 1.1% annualized. None of it moves a hike the swaps have at 97%.
Thursday and Friday are the prints with a decision attached. The Producer Price Index (PPI) lands Thursday at 12:30 GMT, seen at 0.4% on the month after a flat July and 5.3% YoY after 4.7%. The Consumer Price Index (CPI) follows Friday at the same hour, seen at 0.4% on the month after 0.1%, with the annual rate steady at 3.4% and the core measure easing to 2.4%. The Federal Reserve then meets September 15-16 and the Bank of Japan on September 17-18.
Levels and bias
Resistance: The 154.50 area caps the bounce, with Monday's rebound stalling short of 155.00 and handing most of it back. Above that, 156.00 is Monday's open and sits just beneath the session high. The 200-day Exponential Moving Average (EMA) near 158.00 broke on September 3 and now caps any retracement, with the 50-day EMA just under 159.50 above it.
Support: The 154.00 handle is the whole map. Monday's low sits a few pips above it and the pair has spent the European afternoon within forty pips without breaking it. Beneath it the chart carries no traded structure in five months, which leaves 153.50 and 153.00 as round figures rather than tested levels.
Bias: Bearish while 155.00 caps. The daily Stochastic Relative Strength Index (Stoch RSI) has fallen only five points to 82 while the pair lost six Yen, so no oversold reading is available to support a bounce and the oscillator has its whole range left to give back. The intraday reading near 76 rose through the afternoon while price held near the low, which is a corrective bounce rather than a base. The Japanese leg of this trade is priced at 97% and the American leg at 58%, so the week's risk sits on the Dollar side, and a hot CPI print on Friday is what rescues the pair. A daily close above 155.50 invalidates the call.
USD/JPY daily chart
Disclaimer: The content of this article solely reflects the author's opinion and does not represent the platform in any capacity. This article is not intended to serve as a reference for making investment decisions.
You may also like
The Euro waits for the sentence after the rate hike
Ethereum outflows top $300 million as price nears $2,530 resistance
Stellar Liquidity Opens New USDT Route

Bitcoin fund flows show investors trading Fed rate path, not exiting market: CoinShares
Crypto prices
More


