

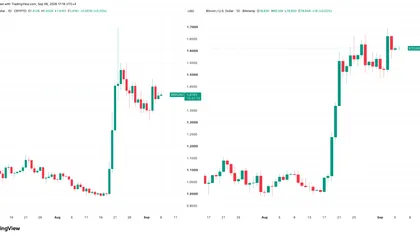
Zcash (ZEC) has experienced a significant rally, climbing nearly 12% in the past 24 hours to approximately $1,190 as of September 7. The privacy-focused cryptocurrency saw its seven-day gains exceed 45% after briefly reaching an intraday high near $1,250.
Zcash surges 45% in 7 days, boosted by ETF inflows and short liquidations
By:Cointurk
Bitget offers one-stop trading for cryptocurrencies, stocks, and gold. Trade now!
A welcome pack worth 6200 USDT for new users! Sign up now!
ETF inflows drive ZEC momentum
The primary catalyst for Zcash’s upward movement has been the launch of Grayscale’s ZCSH spot ETF. This investment fund, now trading on NYSE Arca since August 25, provides regulated access for US investors seeking direct exposure to ZEC.
By September 4, the ETF had reported net inflows totaling $34.4 million, including $12.6 million on September 2 alone. Since its debut, ZCSH’s net assets have grown to around $463 million, indicating sustained investor interest in the product.
As demand for the ETF increased, ZEC’s price moved decisively through key resistance levels. The token accelerated past the $1,000 mark during the session on September 4, gaining roughly 20% on the day. Continued buying pressure pushed ZEC beyond $1,100 and $1,200 in the following sessions.
ETH
SOL
BSC
ROBINHOOD
PAY
USDT
RECEIVE
AAPL
Grayscale positioned ZCSH as a way for investors to gain exposure to the theme of financial privacy within a US-listed investment product, connecting mainstream markets with privacy-focused digital assets.
At the same time, interest in Zcash’s privacy technology has grown, supporting the bullish momentum tied to ETF flows.
Leveraged traders have also played a role in the rapid price action. The initial break above $1,000 triggered liquidations of $34 million to $36 million in short positions as traders attempted to bet against the rally. Further short exposure has continued to build even as ZEC prices climbed.
Key liquidation levels and liquidity zones
According to data from Coinglass, several liquidity concentrations remain above ZEC’s current price. Notable clusters are present between $1,215 and $1,220, $1,245 and $1,255, as well as $1,265 to $1,280. If the token breaks through these ranges, additional short liquidations could trigger more upward movement as bearish traders close positions.
Below the current trading level, liquidity is reported around $1,165 to $1,170, with larger concentrations found near $1,130 to $1,140 and $1,105 to $1,120. These areas may act as potential support levels should the price retrace.
Mini dictionary: Coinglass, a leading analytics platform that provides real-time data on crypto derivatives, including liquidations, open interest, and funding rates across various exchanges.
On-chain developments and governance updates
Zcash’s ongoing NU7 governance process is offering a separate development catalyst. Zcash Labs has set September 14 as the end date for the coinholder vote, during which eligible ZEC holders can participate in deciding on the scope and readiness of the NU7 protocol upgrade.
Eligibility is determined by whether funds were spendable and shielded in the Ironwood pool at the August 24 snapshot date.
Mini dictionary: The Ironwood pool is a Zcash shielded pool that enhances user privacy by allowing fully private transactions between shielded addresses, using advanced cryptography.
ZEC technical analysis and price outlook
ZEC’s daily chart shows an extended upward move since the start of September, when the price stood around $800. The 20-day exponential moving average has increased to $877.85, while the 50-day EMA sits at $710.60. Longer-term EMAs are lower, at $604.60 for 100 days and $506.00 for 200 days, with the current price maintaining strength above all of them.
Bullish momentum remains supported by these technical indicators. The Chaikin Money Flow indicator is at 0.32, indicating that buying pressure continues to outpace selling pressure even as ZEC cleared the $1,000 milestone.
Bullish daily closes above the $1,249 resistance could set the stage for a move toward $1,300. Should buyers remain in control, the next potential target area could be around $1,400.
On the four-hour chart, ZEC is trading near $1,191 after tapping the upper Bollinger Band at $1,255.16. The middle band has sharply risen to $1,074.21, suggesting that the $1,255 level is a key threshold for continuing the breakout.
The Money Flow Index on the four-hour timeframe is at 62.11, which remains below the overbought level of 80 despite the aggressive upward movement.
Failure to reclaim $1,250 could redirect attention to $1,170, an area highlighted by liquidation heatmaps. A further downside move would put the Bollinger Band midpoint at $1,074 as an important support level, and a drop below this could leave a larger gap closer to $900. As long as the price holds above this midpoint, the bullish short-term structure that began after the breakout above $1,000 is expected to remain intact.
EMA timeframe Level
| 20-day EMA | $877.85 |
| 50-day EMA | $710.60 |
| 100-day EMA | $604.60 |
| 200-day EMA | $506.00 |
0
0
Disclaimer: The content of this article solely reflects the author's opinion and does not represent the platform in any capacity. This article is not intended to serve as a reference for making investment decisions.
Understand the market, then trade.
Bitget offers one-stop trading for cryptocurrencies, stocks, and gold.
Trade now!
You may also like
Router Protocol to shut down by September 2026, burn 303 million ROUTE tokens
Cointurk•2026/09/07 10:18
Why Is Akedo (AKE) Up 101.5% in 7 Days? Broad Crypto Rally Fuels Surge
Coinsprobe•2026/09/07 10:12

$14.5 Billion Injection: Will U.S. Treasury Trigger 'Round 2' for Bitcoin and XRP?
UToday•2026/09/07 10:09
SHIB Breakout Could Be Close as Shiba Inu Reaches $0.00000536 Resistance
Cryptonewsland•2026/09/07 10:06

Crypto prices
More
Bitcoin
BTC
$79,413.02
-0.72%

Ethereum
ETH
$2,489.37
-0.41%

Tether USDt
USDT
$0.9999
-0.01%

BNB
BNB
$743.16
-1.96%

XRP
XRP
$1.4
-1.34%

USDC
USDC
$0.9999
+0.01%

Solana
SOL
$105
-1.60%

TRON
TRX
$0.3369
+0.79%

Hyperliquid
HYPE
$87.52
-0.20%

Zcash
ZEC
$1,195.3
+0.79%
How to buy BTC
Bitget lists BTC – Buy or sell BTC quickly on Bitget!
Trade now
Become a trader now?A welcome pack worth 6200 USDT for new users!
Sign up now