

-
Mantle price has broken out of a prolonged descending channel and reclaimed the $0.50–$0.51 zone.
-
Mantle recorded 7.7 million unique addresses in August, while vault assets surpassed $800 million.
-
A sustained breakout could put the $0.60 level first and the $0.90 resistance zone into focus.
MNT price has broken above a months-long descending channel, putting Mantle back on traders’ radar as on-chain adoption and capital deployment accelerate. MNT is trading around $0.57, up more than 4% on the day, after reclaiming the $0.50 region and pushing through the channel resistance. Meanwhile, Mantle’s August metrics show 7.7 million unique Mainnet addresses, more than $800 million in assets secured across native network vaults, and $116.4 million in tokenized active strategies, strengthening the fundamental backdrop behind the technical breakout.
Mantle Adoption Accelerates as On-Chain Metrics Rise
Mantle channel breakout comes as Mantle reports stronger network activity. Data highlighted in the latest market discussion shows total unique addresses on Mantle Mainnet reaching 7.7 million in August 2026. At the same time, total assets secured across native network vaults climbed above $800 million, representing an increase of more than 54% year-to-date.
Mantle’s real-world asset segment is also becoming a notable part of the network’s activity. The data puts tokenized active strategies at more than $116.4 million, positioning RWA-related capital as an important component of the ecosystem. For MNT, these metrics provide fundamental context to the price recovery: the breakout is occurring alongside measurable growth in network participation and capital deployed across Mantle-based products.

Whale Activity Adds Another Layer to MNT Momentum
Wallet activity is also drawing attention. Recent on-chain tracking identified a whale wallet purchasing approximately 1 million MNT for $518,330, alongside 100,000 LINK for $1.16 million within the same period. The wallet had previously been tracked executing a similar strategy in Ethereum, reportedly accumulating 900 ETH between $1,844 and $2,511, representing roughly a 36% move across the cited range. It also moved approximately $3.7 million in USDC, with holdings later reported around $8.8 million.
While individual wallet activity does not guarantee MNT appreciation, the transaction adds a capital-flow signal to the broader setup and reinforces the need to watch whether large holders continue positioning as MNT trades above its breakout zone.
MNT Price Analysis: Can Mantle Price Reach $0.90?
MNT’s daily chart is showing a structural breakout rather than a routine relief bounce. After months of trading inside a descending channel, the token has pushed above the channel’s upper trendline and reclaimed the $0.50–$0.51 breakout zone. The move has also been supported by a pickup in volume, strengthening the breakout signal. With MNT now around $0.57, the next technical hurdle is $0.60; a sustained close above this level would expose $0.70 as the next upside checkpoint. Above that, the broader resistance near $0.88–$0.95 becomes the key medium-term target zone.
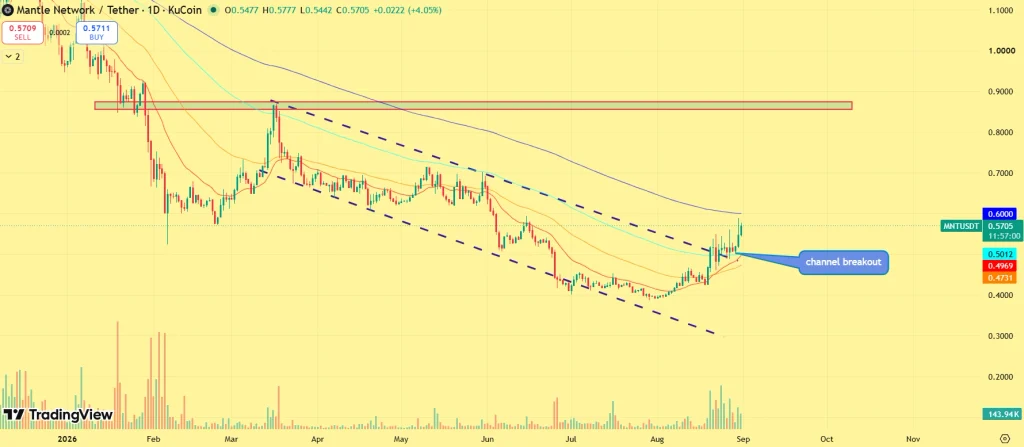
On the downside, $0.50–$0.51 has now shifted from resistance toward crucial support. A decisive daily close back below this area would undermine the breakout thesis and risk sending MNT back toward the $0.47–$0.43 region.
Final Take
MNT’s breakout above the descending channel puts the $0.60 level in immediate focus. A daily close above $0.60 would strengthen the reversal structure and could extend the move toward $0.70, followed by the major $0.88–$0.95 resistance zone. However, the breakout needs to hold above $0.50–$0.51 to remain technically valid. A sustained move below this support would weaken bullish momentum and bring $0.47–$0.43 back into focus.




