
Gold roller coaster: how to deal with it?

In late August, gold experienced a "rollercoaster" trend: within a week, it surged from $4,334 to $4,697, approaching the $4,700 mark, before plunging sharply to around $4,450 under the hawkish impact of the Jackson Hole Symposium. Bulls were caught off guard, but has the foundation of the bull market been shaken? The market is still awaiting an answer.
I. Sharp Rise and Retreat, $4,400 at Risk
The trigger remains clear: on August 18, gold closed at $4,334; the next day, a powerful bullish candlestick pushed it to $4,515, up more than 4% in a single day. The rally continued, reaching $4,603 on August 21, and the current high of $4,697 on August 25.
However, the resistance just before $4,700 was equally pronounced. After the surge, gold started to fall back on August 26. On August 27, unexpectedly strong PCE data and rising US Treasury yields caused gold to drop below $4,600. The real blow came on August 28: Federal Reserve Chairman Kevin Walsh delivered a hawkish signal at the Jackson Hole Global Central Bank Symposium, causing spot gold to plunge $147 in one day to $4,454. The stronghold at $4,600 was completely breached, and the $4,400 mark became the new "line of defense".
II. Technicals: Long Upper Shadow on Weekly Chart, Yearly Line on the Brink
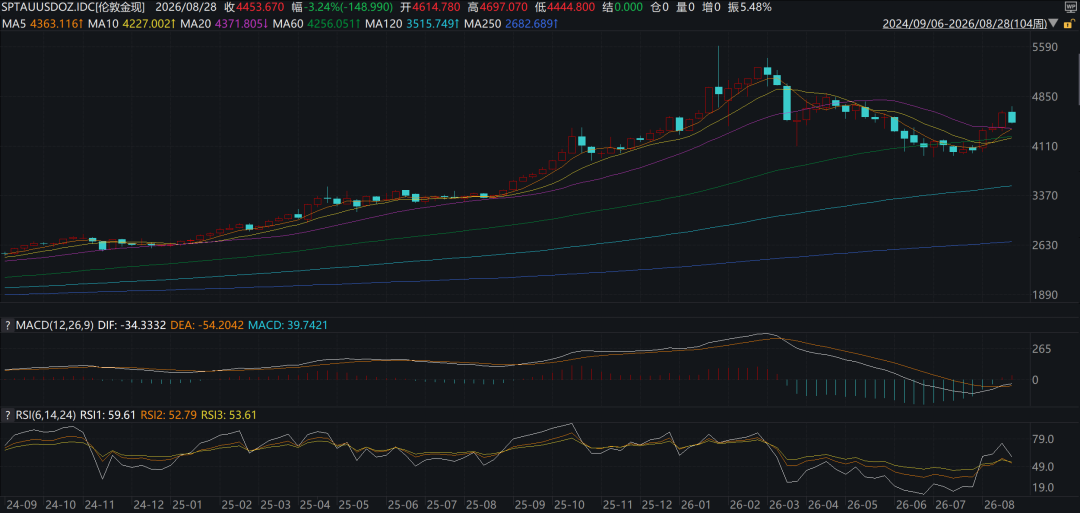
Bulls are now facing a tough challenge technically. The weekly chart displayed a long upper shadow with an almost "bare foot" bearish candlestick, a stark contrast to the previous view that the "weekly chart had just started its move." On the daily chart, gold has fallen below both the 5-day and 10-day short-term moving averages,while the daily RSI(14) has dropped from around 65 at the August 25th high to about 55, indicating that short-term strength has faded but has not yet entered panic territory, with bulls and bears in a temporary stalemate.
Upside resistance remains at the August 25th high of $4,697, which now seems a distant barrier; current gold price at $4,454 is approaching yearly support at $4,413—the "lifeline" in this round: if defended, bullish structure remains; if lost, it faces risk of larger-scale correction.
Current Gold Weekly Situation
III. Macro & Liquidity: The Third Spark Waited for Never Came, Only a Bucket of Ice Water
There were two main drivers behind the previous rally.
The first, and most fundamental one, is the sell-off of long-term US Treasuries driven by concerns over Federal Reserve credibility. In mid-August, 30-year yields spiked to 5.33% and 10-year broke above 4.75%, both the highest since 2007. With US national debt approaching $40 trillion and annual deficits near $2 trillion, dollar credit risk is being repriced.
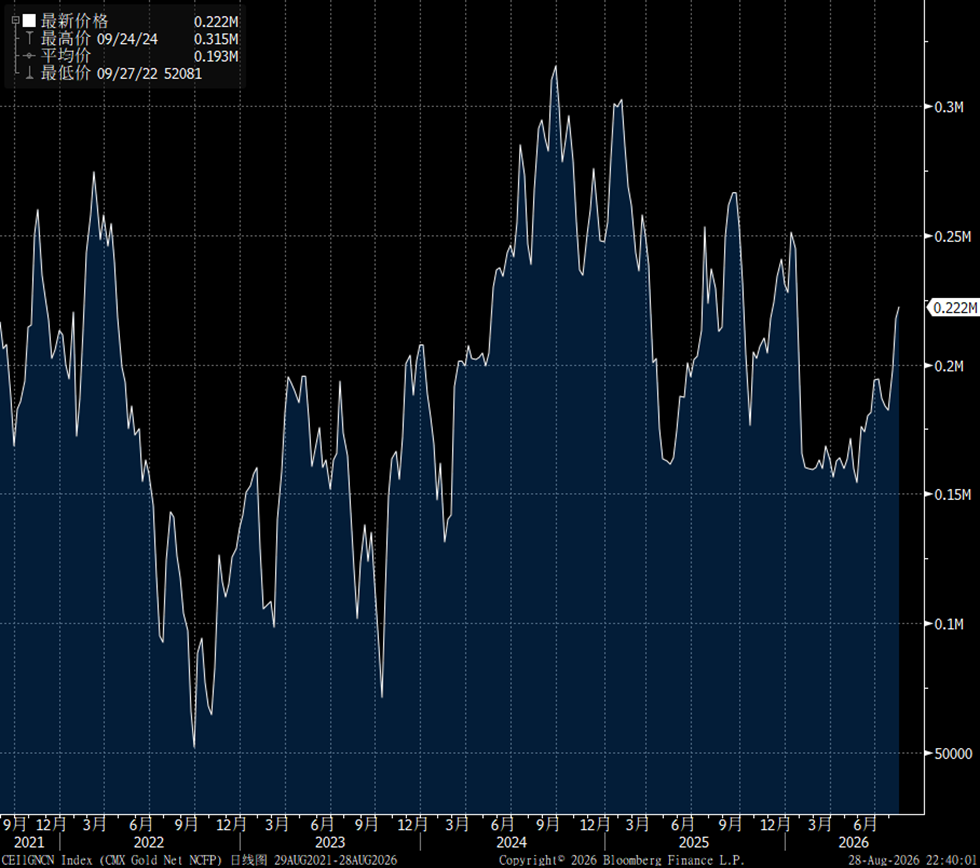
The second driver was the build-up of low volatility from a positioning perspective. From June to early August, gold prices consolidated in a low-volatility range, and after breaking out, trend-following capital chased higher,but without accumulating excessive directional long positions.
After the previous breakout in gold, net positions rose slightly
But what the market received was not another positive catalyst, but a bucket of hawkish cold water from the Fed. On August 28, Walsh stated clearly in Jackson Hole that the "underlying trend in inflation has not substantially improved" and if inflation fails to fall towards 2% quickly enough, the Fed "still has work to do." The probability of a September rate hike implied by federal funds futures jumped from about 36% to 57% at one point; the 10-year Treasury yield rose 5.5 basis points to 4.728%; the US dollar index strengthened simultaneously.
Previously, the market hoped for a dovish Fed to reopen valuation room for zero-yield assets, but was instead met with expectations of "higher for longer" rates. The Treasury’s repo operation on August 20 has been deemed by the market as merely palliative, not addressing the root causes; compared to the $40 trillion stock of Treasuries, the repo scale is insignificant. Of the two expected "sparks," one was extinguished, and instead of a third, a bucket of cold water was thrown in.
IV. Outlook and Strategy: Hold the Yearly Line, Wait for New Signals
Although short-term bulls suffered a heavy blow, considering the possibility of Walsh’s "hawk in name, dove in practice," the sustainability of higher rate expectations remains to be seen. In response, we believe current rhythm is more important than direction.
Observation windows now center on three factors: whether the probability of a September rate hike can fall back to safe levels; whether the 10-year US Treasury yield can stabilize near 4.7% instead of continuing higher; and whether the upcoming US non-farm payrolls report will point towards easing. Any of these catalysts could stabilize gold prices or trigger a secondary bottom.
In terms of strategy, defense should take priority over offense. The $4,400-4,429 annual support zone is currently the most important observation area. If price retests this zone on low volume and holds, light long positions may be attempted, targeting $4,600 (the prior consolidation area); if reclaimed, a retest of the $4,696-4,700 high is possible. However, a decisive break below $4,400 would damage the bullish structure and warrants a stop loss. Short-term resistance levels to the upside are $4,504, $4,526 (200-day moving average), and $4,600.
BFC Talk
With You Through 2026
Welcome to leave us a message in the background
to communicate with us
Disclaimer: The content of this article solely reflects the author's opinion and does not represent the platform in any capacity. This article is not intended to serve as a reference for making investment decisions.
You may also like
CITIC Securities: Maintains baseline expectation that the Fed will keep rates unchanged at the September meeting, awaiting data guidance
CITIC Securities maintains its baseline expectation that the Federal Reserve will keep rates unchanged at the September meeting. Future inflation and employment data will be crucial.

Ripple CLO: Clarity Act Vote Would Boost U.S. Jobs and Economic Growth
Euro edges higher to near 1.1600 ahead of German CPI inflation release
Bitcoin posts best August since 2017 with 25% rally, but year-to-date losses persist
Crypto prices
More


