
Broadcom Stock Drops to $364 as $120B Marvell Shock Rattles AI Chip Bets

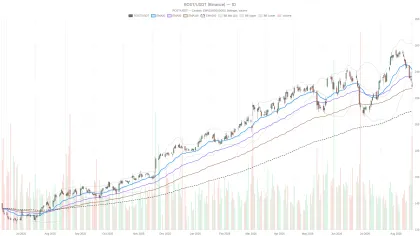
Broadcom stock closed at $364.03, well below its 20- and 50-day EMAs near $393, after a sharp pullback triggered by competitive and financing headlines. The gap between price and moving averages confirms this was a fast, aggressive correction — not a slow grind lower.
Summary
Key takeaways
- Broadcom stock closed at $364.03, trading below all major daily moving averages including the EMA200 at $368.81.
- Daily RSI14 sits at 36.19 — weak but not yet oversold — with MACD histogram at -5.77 confirming bearish momentum.
- Google’s expanded Marvell partnership triggered what reports called a “$120 billion Marvell shock.”
- Broadcom is reportedly negotiating a debt package up to nearly $100 billion to fund AI infrastructure tied to Anthropic.
- Short-term charts show early stabilization signals, but the 1-hour trend remains explicitly bearish.
Daily Structure Points to a Broadcom Stock Correction, Not Capitulation
Broadcom stock’s daily structure confirms a correction is underway, not a full capitulation. Price sits below every major moving average, yet the system’s regime read remains neutral rather than outright bearish.
On the daily timeframe, price closed at $364.03 against an EMA20 and EMA50 both clustered around $393. The EMA200 sits at $368.81. This means price is below every major moving average — a bearish structural setup. However, the system’s regime classification is tagged “neutral,” suggesting the decline has not yet established a new dominant trend.
Meanwhile, momentum indicators reinforce the cautious read. Daily RSI14 sits at 36.19 — weak, but not yet in oversold territory. The daily MACD line at -3.1 against a signal of 2.66 produces a histogram of -5.77. That wide negative spread confirms bearish momentum has been building rather than fading.
Notably, Bollinger Bands show price close to the lower band at $355.84, with the mid-band far above at $396.74. Volatility has clearly expanded, and ATR14 at 15.5 reflects a market swinging in wider daily ranges. Pivot levels for the session sit at $364.47 (PP). Resistance stands at $366.68 and support at $361.81 — a narrow band likely to define the next directional move.
1H Timeframe: Bearish Regime, But Momentum Is Losing Steam
Meanwhile, the 1-hour chart confirms the daily bias in structure, though not fully in momentum. Price at $364.24 remains beneath the EMA20 ($370.40), EMA50 ($384.74), and EMA200 ($393.87). The regime on this timeframe is explicitly flagged as bearish. RSI14 reads 31.94, edging toward oversold conditions.
However, the MACD line (-7.79) and signal (-9.01) are both deeply negative, yet the histogram has turned slightly positive at 1.22. That detail matters: it signals the pace of decline is decelerating, even if the broader trend remains down. In short, the bigger picture is a correction still searching for a floor. The shorter timeframe shows tentative signs that selling pressure is easing — without yet reversing.
15-Minute View: A Pause Near the Pivot
Zooming into the 15-minute chart, price at $364.24 sits essentially on its EMA20 ($364.30), with the EMA50 slightly higher at $366.81. RSI14 has normalized to 48.39 — a neutral reading that reflects sideways churn rather than active selling. The MACD histogram is marginally positive at 0.17, mirroring the same stabilization tone seen on the 1-hour chart.
Bollinger Bands are notably tight, ranging from $362.68 to $365.41. The pivot point at $363.90 lines up almost exactly with where price is trading. This is a market taking a breather, not one signaling a clean reversal just yet.
Bullish Scenario for Broadcom Stock
A bullish reversal for Broadcom stock requires price to hold above $361.81 and reclaim the 1-hour EMA20 near $370.40.
If positive MACD histogram readings on the 1-hour and 15-minute charts extend further, a push toward the daily pivot resistance at $366.68 becomes plausible.
On the fundamental side, continued progress on the AI infrastructure financing could reframe the narrative away from competitive fears. This applies to both the $60 billion tranche and the larger $100 billion package. A sustained recovery would likely need RSI on the daily chart to push back above 40 as a first confirmation.
Bearish Scenario for Broadcom Stock and What Would Invalidate a Recovery
A breakdown below $361.81 would invalidate any near-term recovery and open the door toward the daily lower Bollinger Band at $355.84.
A break through the 1-hour support at $362.76 would add confirmation to the bearish case. The lower Bollinger Band at $355.84 then becomes the next meaningful target, representing a significant downside extension given ATR14 at 15.5.
Meanwhile, if the daily MACD histogram continues widening in negative territory rather than stabilizing, the correction would likely deepen. The same applies if RSI slips further without finding support near current levels. Continued market concern over Google’s Marvell partnership, or any signs that the AI chip financing talks stall, would add pressure to this scenario.
Closing Take on Broadcom Stock
Broadcom stock sits in a transitional zone: the daily trend has turned lower, but short-term momentum indicators show early stabilization rather than fresh selling. Overall, volatility remains elevated, and the narrow band between the S1 and R1 pivot levels suggests the market is still deciding its next direction. Given the mix of competitive headlines around Marvell and constructive AI financing news, near-term price action is likely to stay reactive to headlines. Therefore, positioning around these levels calls for discipline, given the conflicting signals between timeframes and the still-elevated volatility backdrop.
FAQ
What triggered the recent sell-off in Broadcom stock?
Google’s expanded custom-chip partnership with Marvell rattled the market’s view of Broadcom’s dominance in AI silicon, triggering what reports called a “$120 billion Marvell shock.” At the same time, Broadcom is reportedly negotiating a debt package that could reach nearly $100 billion. An initial $60 billion tranche has been discussed with lenders including Blackstone and Apollo to fund AI infrastructure tied to Anthropic.
What are the key support levels for Broadcom stock?
The critical support sits at $361.81 (daily S1), with the next major level at the daily lower Bollinger Band of $355.84. On the 1-hour chart, support at $362.76 provides an additional floor beneath current price.
Is Broadcom stock’s correction likely to continue?
Momentum indicators across the 1-hour and 15-minute charts show early signs of stabilization. The 1-hour MACD histogram has turned positive at 1.22, signaling decelerating selling pressure. However, the daily trend remains bearish, and a recovery would require reclaiming the 1-hour EMA20 near $370.40.
Article produced with the assistance of artificial intelligence and reviewed by the editorial team.
Disclaimer: The content of this article solely reflects the author's opinion and does not represent the platform in any capacity. This article is not intended to serve as a reference for making investment decisions.
You may also like
Ripple CEO Garlinghouse says AI drives growth, predicts record year despite market downturn
S&P Global US PMIs expected to ease slightly in August, still showing solid growth
Ross Stores Stock Jumps 8% After Hours as Blowout Q2 Meets Oversold Technicals
$ASTER Whale Locks In $2.36M Profit, Holds $2.27M Long Position

Crypto prices
More


