
GoPlus Security crypto holds bullish daily trend despite oversold RSI dip

As of August 19, 2026, GoPlus Security crypto is trading in a tight sub-cent range against USDT, with the daily structure still leaning bullish while hourly readings show a market that has cooled off sharply. The gap between macro trend and short-term tape defines the current outlook.
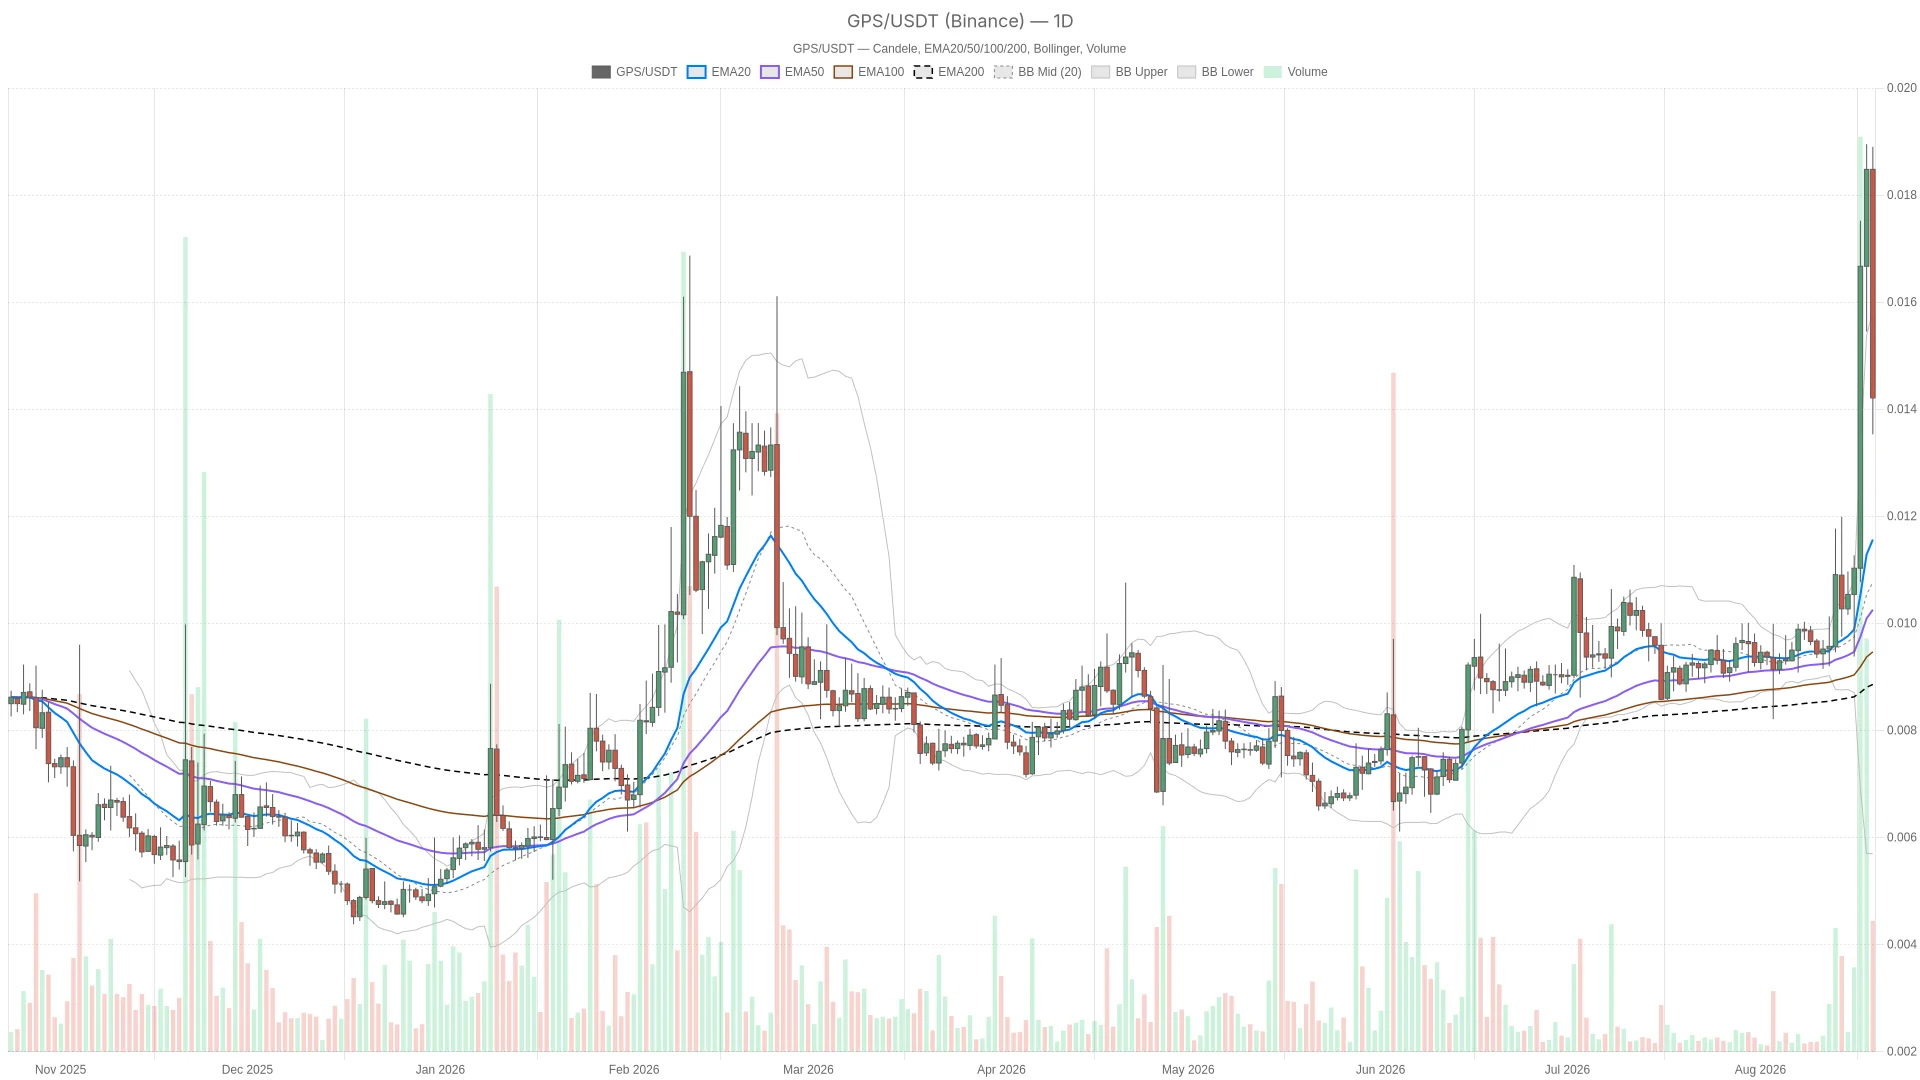 GPS/USDT — daily chart with candlesticks, EMA20/EMA50 and volume.
Summary
Key takeaways
- The daily chart maintains a bullish regime with RSI14 at 61.76, but MACD remains flat with no momentum confirmation.
- Hourly RSI14 has dropped to 29.16, while the 15-minute RSI14 sits deep in oversold territory at 18.18.
- Price trades below its daily pivot point, creating a subtle tension against the bullish structure label.
- Bitcoin dominance at 56.56% and Fear & Greed Index at 46 (Fear) suggest limited tailwinds for smaller-cap tokens like GPS.
Daily Structure: The Bullish Bias Is Still Technically Intact
The daily chart maintains a bullish regime, with RSI14 at 61.76 sitting comfortably above the 50 midline without touching overbought territory — typically a sign that upside room remains before sellers step in. For GoPlus Security crypto, price is sitting close to its EMA20, EMA50 and EMA200, all clustered tightly around the same level. This suggests a coiled setup rather than a runaway trend. The MACD line, signal and histogram are all flat at zero, however. That is a yellow flag: the trend, while structurally bullish, is not being confirmed by any real momentum thrust.
The Bollinger Bands add context — the mid-band sits where price is trading, with the upper band notably higher and the lower band roughly matching current price. That reflects a market compressed near the lower half of its own volatility envelope, with more room to expand upward than downward if buyers return. Meanwhile, the daily pivot point sits above current price, with resistance (R1) at the same level and support (S1) just below. Price is technically below its own pivot, a subtle tension against the bullish regime label.
Hourly and 15-Minute Picture: Momentum Has Cooled Off Hard
Short-term momentum has cooled off significantly, with the 1H RSI14 dropping to 29.16 — right on the edge of oversold — and the 15-minute RSI14 sinking to 18.18 deep into exhaustion territory. On the 1H chart, price is trading below its EMA20 and EMA50, both of which sit noticeably higher. The regime here is neutral, not bullish, which indicates the daily trend has not been reinforced at the hourly level. If anything, it is being actively tested.
Zooming into the 15-minute chart, price sits well below all three EMAs — the 20, 50 and 200 — which are again bunched together above current price. That is a classic short-term exhaustion signature. Moreover, MACD stays flat across both the 1H and 15-minute timeframes, offering no real confirmation either way. Pivot levels on these shorter frames are compressed and close together, reflecting how narrow the actual trading range has been. In practice, the real signal comes from where price sits relative to the bands and EMAs, not from a volatility number.
Where This Leaves the GPS Trade
The daily chart still argues for a bullish underlying structure, but it lacks validation from both momentum indicators and a price reclaim of pivot resistance. The hourly and 15-minute charts show a market that has pulled back hard enough to hit oversold conditions. This is exactly the kind of setup where the next move — bounce or breakdown — tends to define the near-term narrative for GPS.
Bullish scenario: If GPS stabilizes and reclaims the daily pivot resistance zone, with the 1H and 15m RSI climbing back above 50 and price pushing above the EMA cluster on shorter timeframes, that would align all three timeframes in the same direction. Upside room exists toward the daily Bollinger upper band, which sits meaningfully above current price.
Bearish scenario: If the oversold bounce fails and price breaks below daily S1 support, that would undercut the bullish daily regime and open the door to a deeper retracement. Watch the daily RSI in particular — a drop back toward the 50 line would remove the momentum cushion that currently supports the bullish case. A failure to reclaim the EMA cluster on the 1H chart would confirm sellers remain in control short-term.
Market Backdrop
The broader crypto market is not offering GPS much of a tailwind, with total market capitalization sitting around $2.283 trillion and Bitcoin dominance elevated at 56.56%. According to CoinGecko data, the total market is up a modest 0.44% over 24 hours — not the kind of move that signals strong risk-on appetite. The Fear & Greed Index reads 46, classified as Fear, fitting the cautious and indecisive tone visible across the technical picture.
There is also a relevant undercurrent in DeFi activity, since GoPlus Security’s relevance is tied to on-chain and DEX ecosystem health. DefiLlama figures show a mixed fee picture: Uniswap V3 fees are down 26.67% over 24 hours and down 32.15% over seven days, while Curve DEX fees are up 110.29% over 30 days. Smaller venues like Fluid DEX and Ekubo are seeing growth. That rotation within DeFi itself can either support or weigh on infrastructure-adjacent tokens.
Positioning and Risk
No clean, high-conviction directional call emerges from the current setup, as the daily trend is bullish on paper but unconfirmed, while shorter timeframes are oversold without yet turning. That combination usually means elevated short-term volatility risk in either direction. Traders watching GPS should treat current levels as a decision zone rather than a settled trend. Position sizing and patience matter more here than trying to predict which way the next candle breaks. The charts are genuinely undecided, and prudent traders will wait for confirmation before committing to either side.
FAQ
What is the current trend for GPS?
The daily chart maintains a bullish regime with RSI14 at 61.76 above the 50 midline. However, this bullish bias lacks momentum confirmation, as the MACD remains flat at zero. On shorter timeframes, the trend is neutral to oversold, with the 1H RSI14 at 29.16 and the 15-minute RSI14 at 18.18.
Is GPS oversold or overbought right now?
On the 15-minute chart, GPS is deep in oversold territory with an RSI14 reading of 18.18. The 1H RSI14 at 29.16 is also near the oversold threshold. On the daily timeframe, however, RSI14 at 61.76 sits in neutral-bullish territory, well below overbought levels.
What are the key levels to watch for GPS?
The daily pivot point sits above current price, with resistance (R1) at that same level. Support (S1) sits just below where GPS is currently trading. The daily Bollinger upper band offers a meaningful upside target, while a break below S1 would undercut the bullish structure and open the door to a deeper retracement.
How does the broader crypto market affect GPS?
With total market capitalization around $2.283 trillion and Bitcoin dominance at 56.56%, capital is staying concentrated in major assets rather than rotating into smaller-cap tokens like GPS. The Fear & Greed Index at 46 (Fear) further reflects the cautious sentiment weighing on the broader market and limiting upside tailwinds.
{"@context":"","@type":"FAQPage","mainEntity":[{"@type":"Question","name":"What is the current trend for GPS?","acceptedAnswer":{"@type":"Answer","text":"The daily chart maintains a bullish regime with RSI14 at 61.76 above the 50 midline. However, this bullish bias lacks momentum confirmation, as the MACD remains flat at zero. On shorter timeframes, the trend is neutral to oversold, with the 1H RSI14 at 29.16 and the 15-minute RSI14 at 18.18."}},{"@type":"Question","name":"Is GPS oversold or overbought right now?","acceptedAnswer":{"@type":"Answer","text":"On the 15-minute chart, GPS is deep in oversold territory with an RSI14 reading of 18.18. The 1H RSI14 at 29.16 is also near the oversold threshold. On the daily timeframe, however, RSI14 at 61.76 sits in neutral-bullish territory, well below overbought levels."}},{"@type":"Question","name":"What are the key levels to watch for GPS?","acceptedAnswer":{"@type":"Answer","text":"The daily pivot point sits above current price, with resistance (R1) at that same level. Support (S1) sits just below where GPS is currently trading. The daily Bollinger upper band offers a meaningful upside target, while a break below S1 would undercut the bullish structure and open the door to a deeper retracement."}},{"@type":"Question","name":"How does the broader crypto market affect GPS?","acceptedAnswer":{"@type":"Answer","text":"With total market capitalization around $2.283 trillion and Bitcoin dominance at 56.56%, capital is staying concentrated in major assets rather than rotating into smaller-cap tokens like GPS. The Fear & Greed Index at 46 (Fear) further reflects the cautious sentiment weighing on the broader market and limiting upside tailwinds."}}]}
Article produced with the assistance of artificial intelligence and reviewed by the editorial team.
Disclaimer: The content of this article solely reflects the author's opinion and does not represent the platform in any capacity. This article is not intended to serve as a reference for making investment decisions.
You may also like
BofA Survey: 47% of Fund Managers Bet on European Stocks Outperforming US Stocks; Optimism Returns to Pre-Iran War Highs
About 47% of fund managers expect European stocks to slightly outperform US stocks in terms of returns over the next year, the highest proportion since the outbreak of the Iran War in February 2026.

KiiChain Price Prediction: Can KII Break $0.07141 Amid Rising Market Activity?
UK July CPI Hits Four-Month High: Energy Bill "Flooding" Impact Arrives as Expected, but Cooling Services Inflation Gives Bank of England Breathing Space
The UK's inflation rate has risen to a four-month high, with increased energy bills being the main driving force.

Crypto prices
More


