
Macroeconomic Data Analysis for July: K-shaped Pattern Continues

My new book, "Overcoming the Natural Interest Rate Trap", has been published. Introduction may be foundhere,here. The color illustrations in the book can be foundhere.It is recommended to purchase genuine copies on Tmall and JD.com.
At 15:00 (UTC+8) on August 17, 2026, the National Bureau of Statistics released data for July on industry, consumption, and real estate. Here is a brief analysis.
I. Continuation of the Industrial K-shaped Pattern
Year-on-year growth and year-to-date growth of industrial value added above designated size are shown in Figure 1. The year-on-year growth for July alone is 4.5%, year-to-date is 5.3%, and the trend is downward.
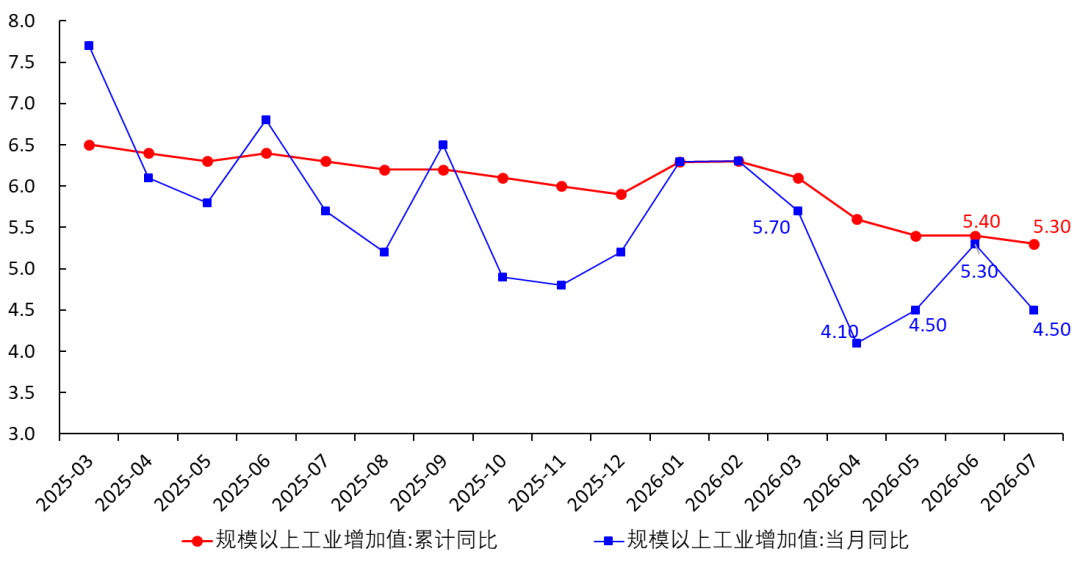
Figure 1 Industrial Value Added Growth Rate
Applying seasonal adjustment to data from January 2021 to July 2026 yields Figure 2 below. After seasonal adjustment, July's year-on-year monthly growth is 4.89%, remaining below the trend value (green line) for four consecutive months. This means that industrial production remains weak, and the year-on-year growth rates for PPIRM and PPI should be on a downward trend (which is consistent with reality).
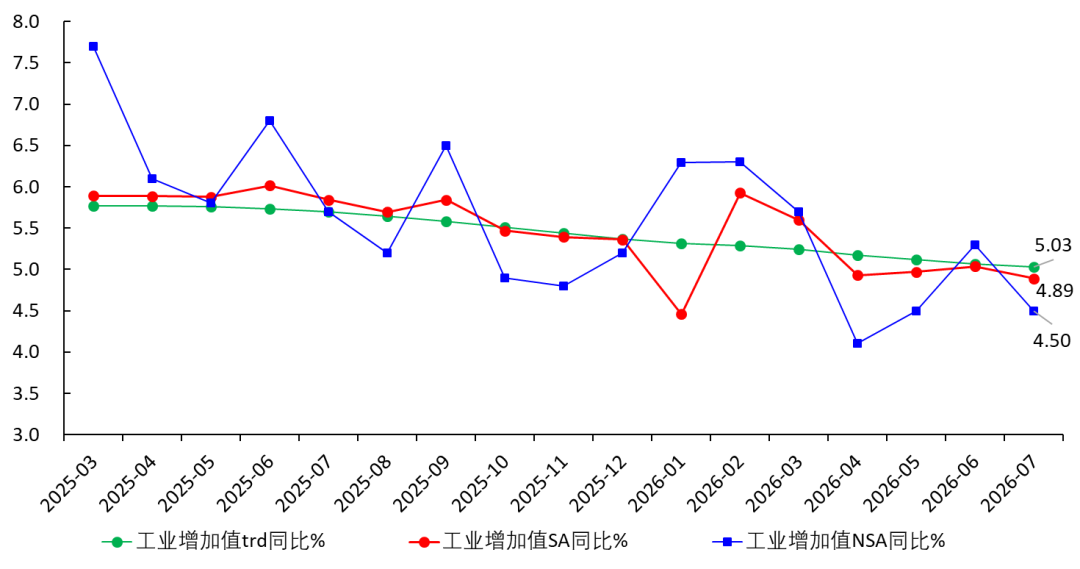
Figure 2 Seasonally Adjusted Industrial Value Added Growth Rate
While overall industrial value added growth continues to decline, traditional industries are growing slowly and the mining industry is experiencing negative growth (Figure 3). Meanwhile, the equipment manufacturing industry is growing rapidly (12.3% year-on-year in July), with segments such as electronics, railways, shipping, aerospace, instrumentation, and specialized equipment all seeing double-digit growth. High-tech manufacturing value added grew by 16.9% in July. Thus, equipment manufacturing and high-tech manufacturing are forming a clear K-shaped pattern with traditional industries. The faster these new industries replace traditional ones as drivers of the economy, the quicker economic growth and employment will stabilize.
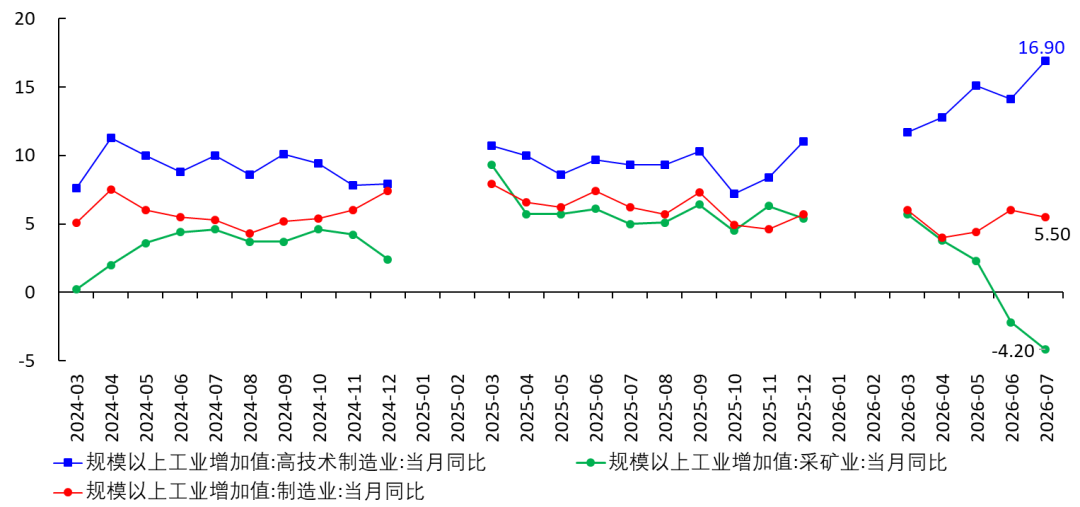
Figure 3 Year-on-Year K-shaped Industrial Value Added (%)
II. Year-to-date Growth Rate of Fixed Asset Investment
The year-to-date year-on-year rates for different types of fixed asset investments are shown below, akin to eating Dove chocolate while playing on water slides at a Maya Waterpark.
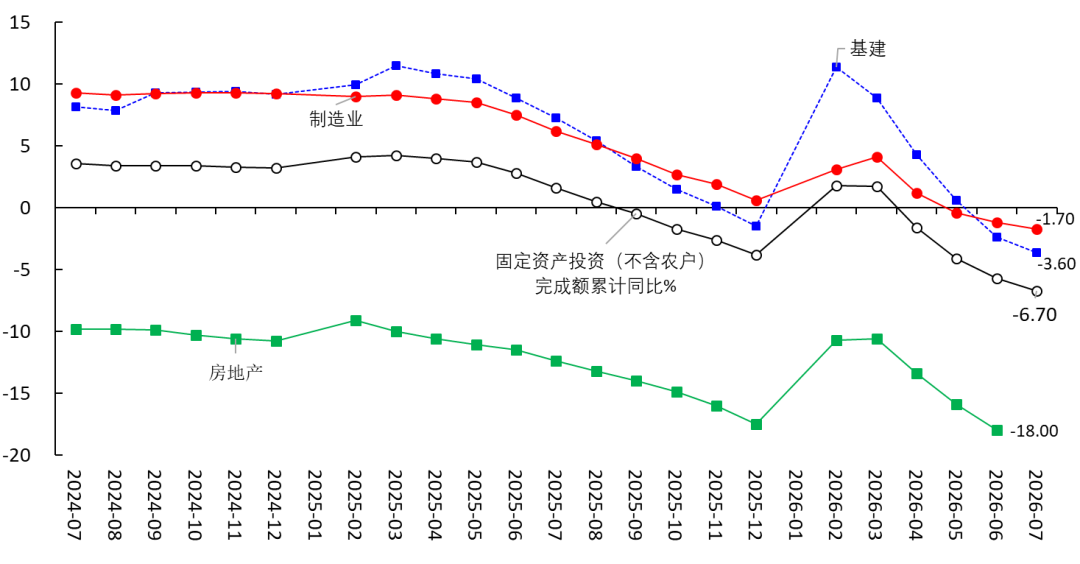
Figure 4 Nominal Fixed Asset Investment Cumulative YoY (%)
This is actually normal. According to my estimates, the current natural interest rate (marginal return on physical capital) is about 1.2-1.3%, while the current real interest rate for enterprises (weighted average loan rate minus CPI) is above 2%. In the future, as CPI returns to near 0% year-on-year, real interest rates will gradually rise further, meaning the cost of financing will exceed the returns on investment.
In this context, fixed asset investment is not cost-effective for most companies, especially traditional enterprises. The rational choice is to reduce investment and lend money to high-tech industries with higher marginal capital returns. These ideas are discussed in detail in my book "Overcoming the Natural Interest Rate Trap".
This means that a relatively high real interest rate is forcing low-ROE companies to exit the market, leading to market consolidation; only high-ROE firms can survive. In other words, the high real interest rate exacerbates the K-shaped economy and is objectively accelerating economic transformation.
III. Consumption
Figure 5 shows that the total retail sales of consumer goods rose 0.62% year-on-year in July, for a year-to-date of 1.23%; for units above a certain size, year-on-year was -3.43%, all continuing the downward trend.
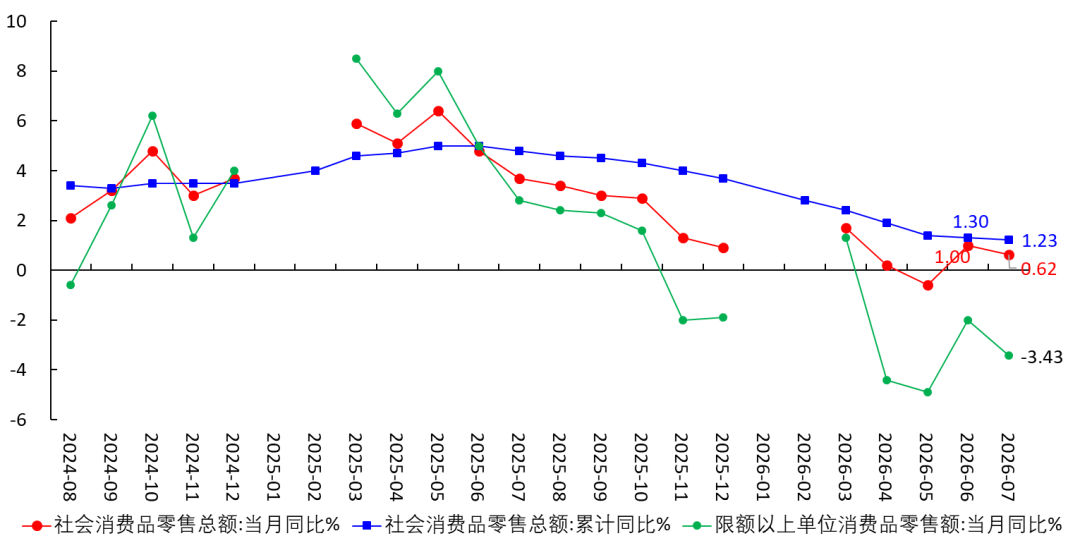
Figure 5 Total Retail Sales of Consumer Goods Growth Rate
If you deflate the nominal social retail sales with CPI, the result is as in Figure 6—real growth is still near zero.
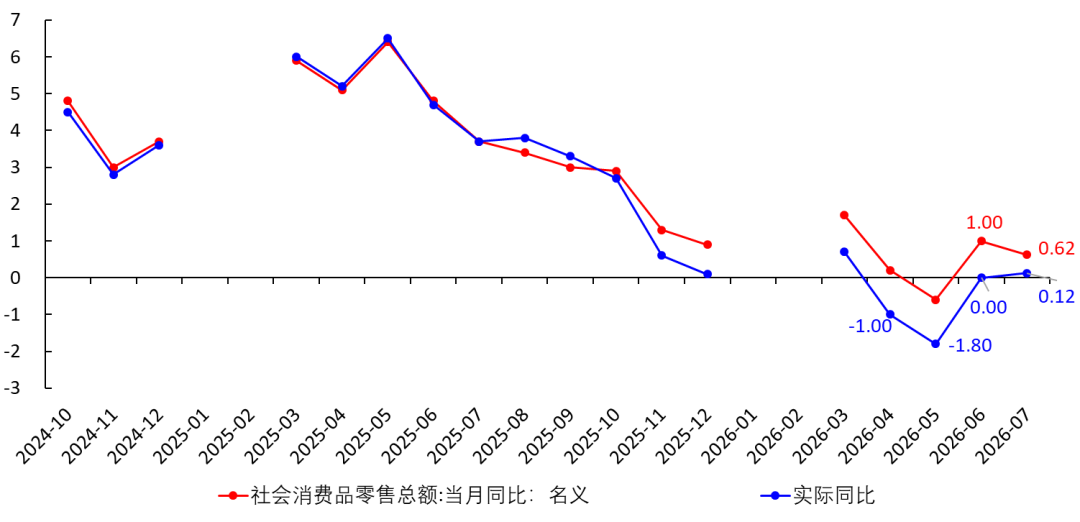
Figure 6 Real Social Retail Growth Rate
If the impact of automobiles is removed from social retail, Figure 7 is observed:
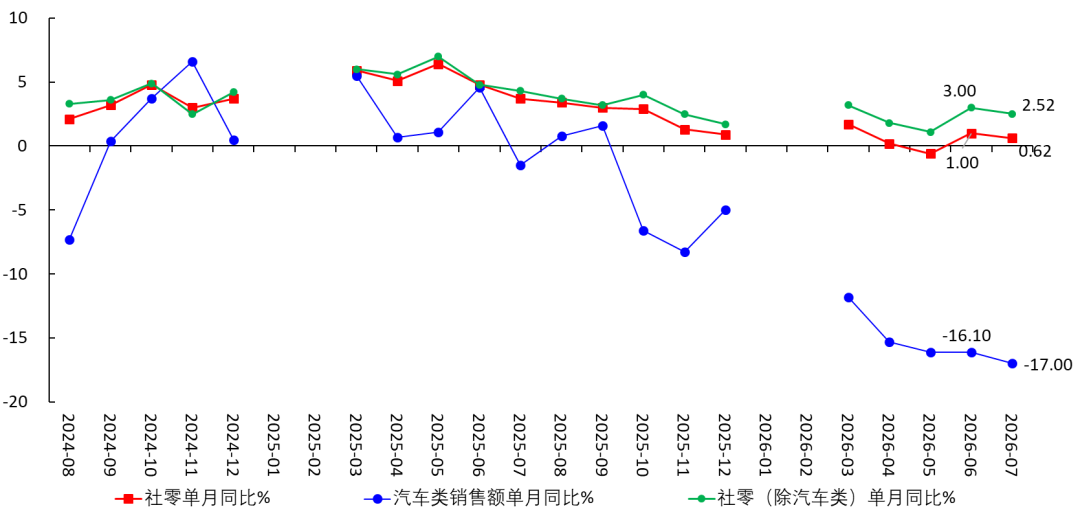
Figure 7 Social Retail Growth Excluding Automobiles
Figure 8 shows the monthly growth rates of major categories of retail sales. Among these: [1] Communication equipment grew quickly, likely due to a low base in June/July 2025 and the purchase of mobile phones by incoming university students; [2] All real estate-related categories (automobiles, home appliances, furniture, building and decoration materials) recorded negative growth.
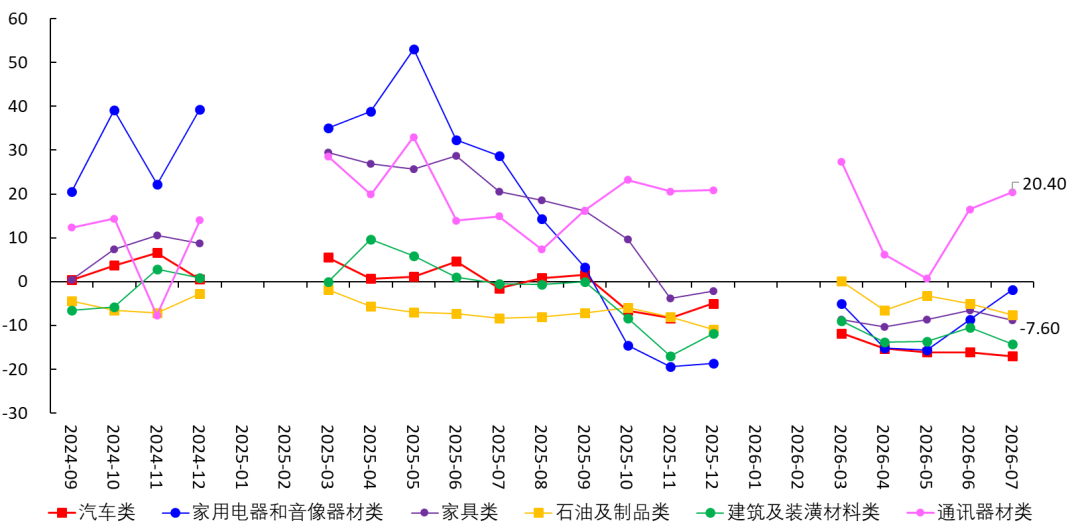
Figure 8 Monthly YoY of Major Retail Categories
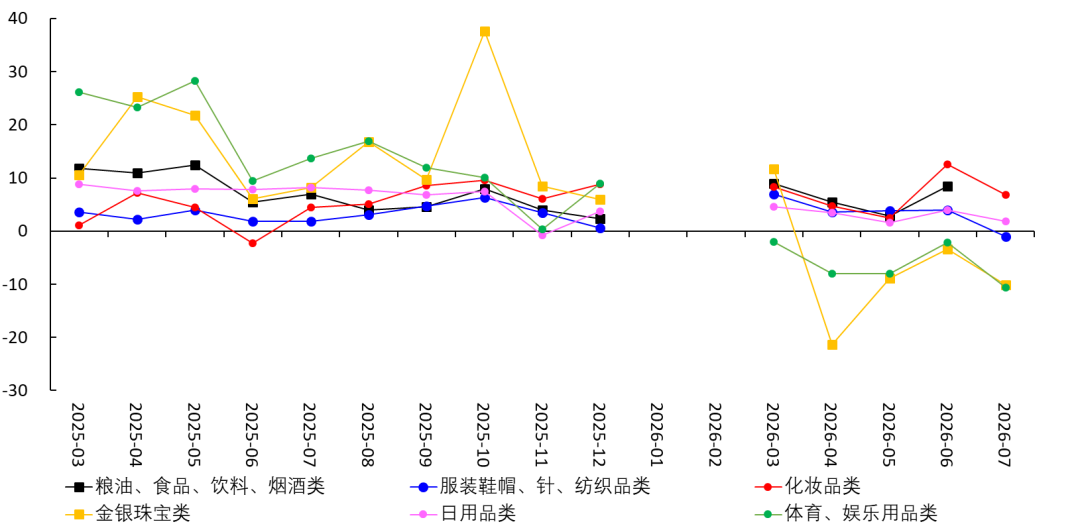
Figure 9 Monthly YoY of Major Retail Categories
The growth rate of cosmetics retail sales is relatively high, which I believe is due to two factors: First, consumption among high-income groups has not declined, thus their cosmetics consumption remains unchanged; secondly, many people see makeup as indispensable—while they cut spending elsewhere, they do not reduce their spending on cosmetics.
As I previously suggested, with weakening consumption growth,CPIwill continue to decline and return to near0%. This is now being validated.
IV. Scale of Household Sector Deleveraging
In my article on July 17, I recommended the following indicator to measure the intensity of household deleveraging:
Deleveraging Intensity = Scale of Deleveraging / Scale of Consumption (1)
Where:
Scale of Deleveraging = Incremental change in household (RMB and FX) deposits minus loans (2)
Scale of Consumption = Total retail sales of consumer goods for the period (3)
Based on available data, the calculated monthly deleveraging intensity is shown in Table 1:
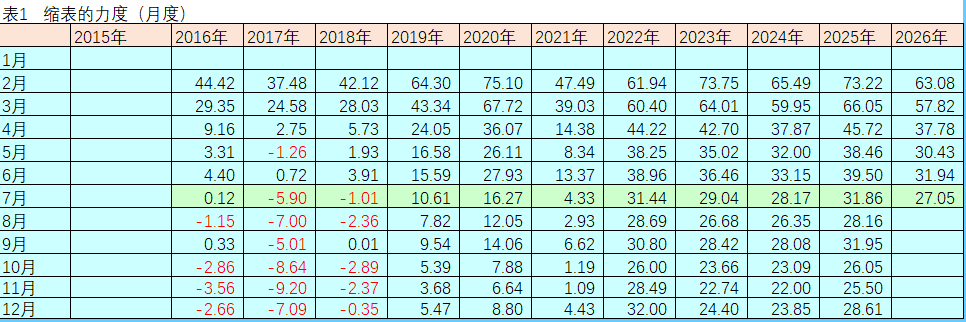
Plotted in a chart, this is shown as Figure 10. It can be seen that in 2026, the deleveraging intensity curve closely follows, but is slightly lower than, that of 2025.
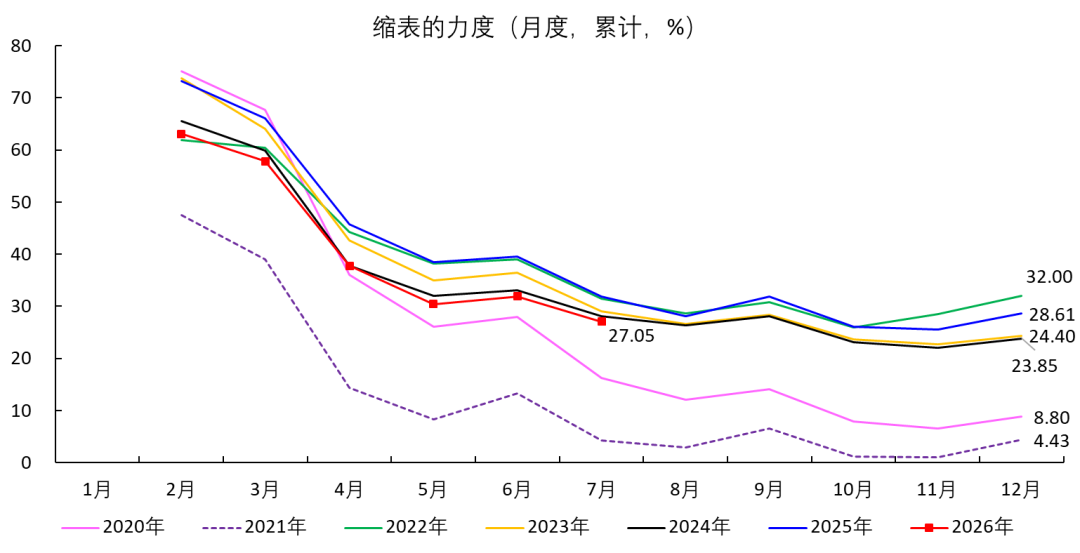
Figure 10 Intensity of Deleveraging
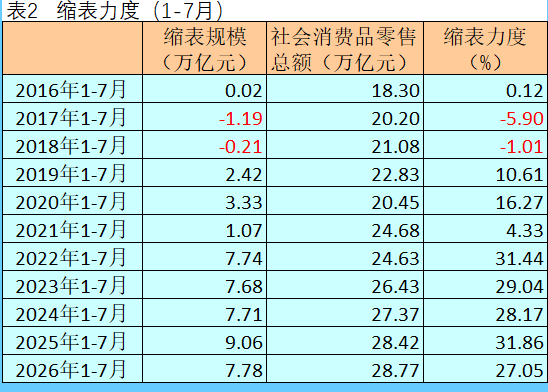
As I mentioned in the article "Deposits weak, loans even weaker" on August 15 (since deleted), from January to July 2026, household deposits increased by RMB 6.96 trillion, lower than the same period from 2022-2025; loans were even lower, dropping by RMB 0.83 trillion, posting the first-ever negative value. The net deleveraging scale for January to July 2026 is RMB 7.78 trillion, higher than previous years (except 2025).
However, as total retail sales of consumer goods for January to July 2026 are still growing positively, the deleveraging intensity calculated by formula (1) is lower than in previous years. If retail sales turn negative in the future, the deleveraging intensity will rise accordingly.
Disclaimer: The content of this article solely reflects the author's opinion and does not represent the platform in any capacity. This article is not intended to serve as a reference for making investment decisions.
You may also like
Has the Asian stock market rebound peaked? U.S. Treasury yields surge, 17 out of 20 times in history Asia-Pacific stocks fell
The rapid rise in U.S. Treasury yields is becoming one of the biggest risks to the AI-driven stock market rally in Asia, highlighting the vulnerability of technology companies to high borrowing costs.

Another evidence of global bond market under pressure! Investors demand higher risk premiums, Germany's 30-year government bond issuance yield expected to hit 15-year high
As investors demand higher compensation for providing financing to governments burdened by rising debt and still grappling with inflation, Germany is expected to face its highest financing costs in 15 years in a large-scale long-term bond issuance.

Jane Street adds $630M in Bitcoin ETFs – Is Wall Street buying the dip?
Canadian Dollar receives support from firm oil prices
Crypto prices
More


