
A chart showing commodity support and resistance: Gold, Silver, Oil, Gas + Platinum, Palladium, Copper, and Agricultural Futures (August 18, 2026)

Huitong Network, August 18—— One chart summarizes commodity support and resistance: Gold, Silver, Oil, Gas + Platinum, Palladium, Copper + Agricultural futures, updated on Tuesday, August 18, 2026, 07:25 (UTC+8). Specifically covers 14 varieties including Gold, Silver, Platinum, Palladium, Copper + Crude Oil, Natural Gas, Fuel Oil + Wheat, Corn, Cotton. For more details, refer to Huitong Finance's special chart.
One chart summarizes commodity support and resistance: Gold, Silver, Oil, Gas + Platinum, Palladium, Copper + Agricultural futures, updated on Tuesday, August 18, 2026, 07:25 (UTC+8). Specifically covers 14 varieties including Gold, Silver, Platinum, Palladium, Copper + Crude Oil, Natural Gas, Fuel Oil + Wheat, Corn, Cotton. For more details, refer to Huitong Finance's special chart.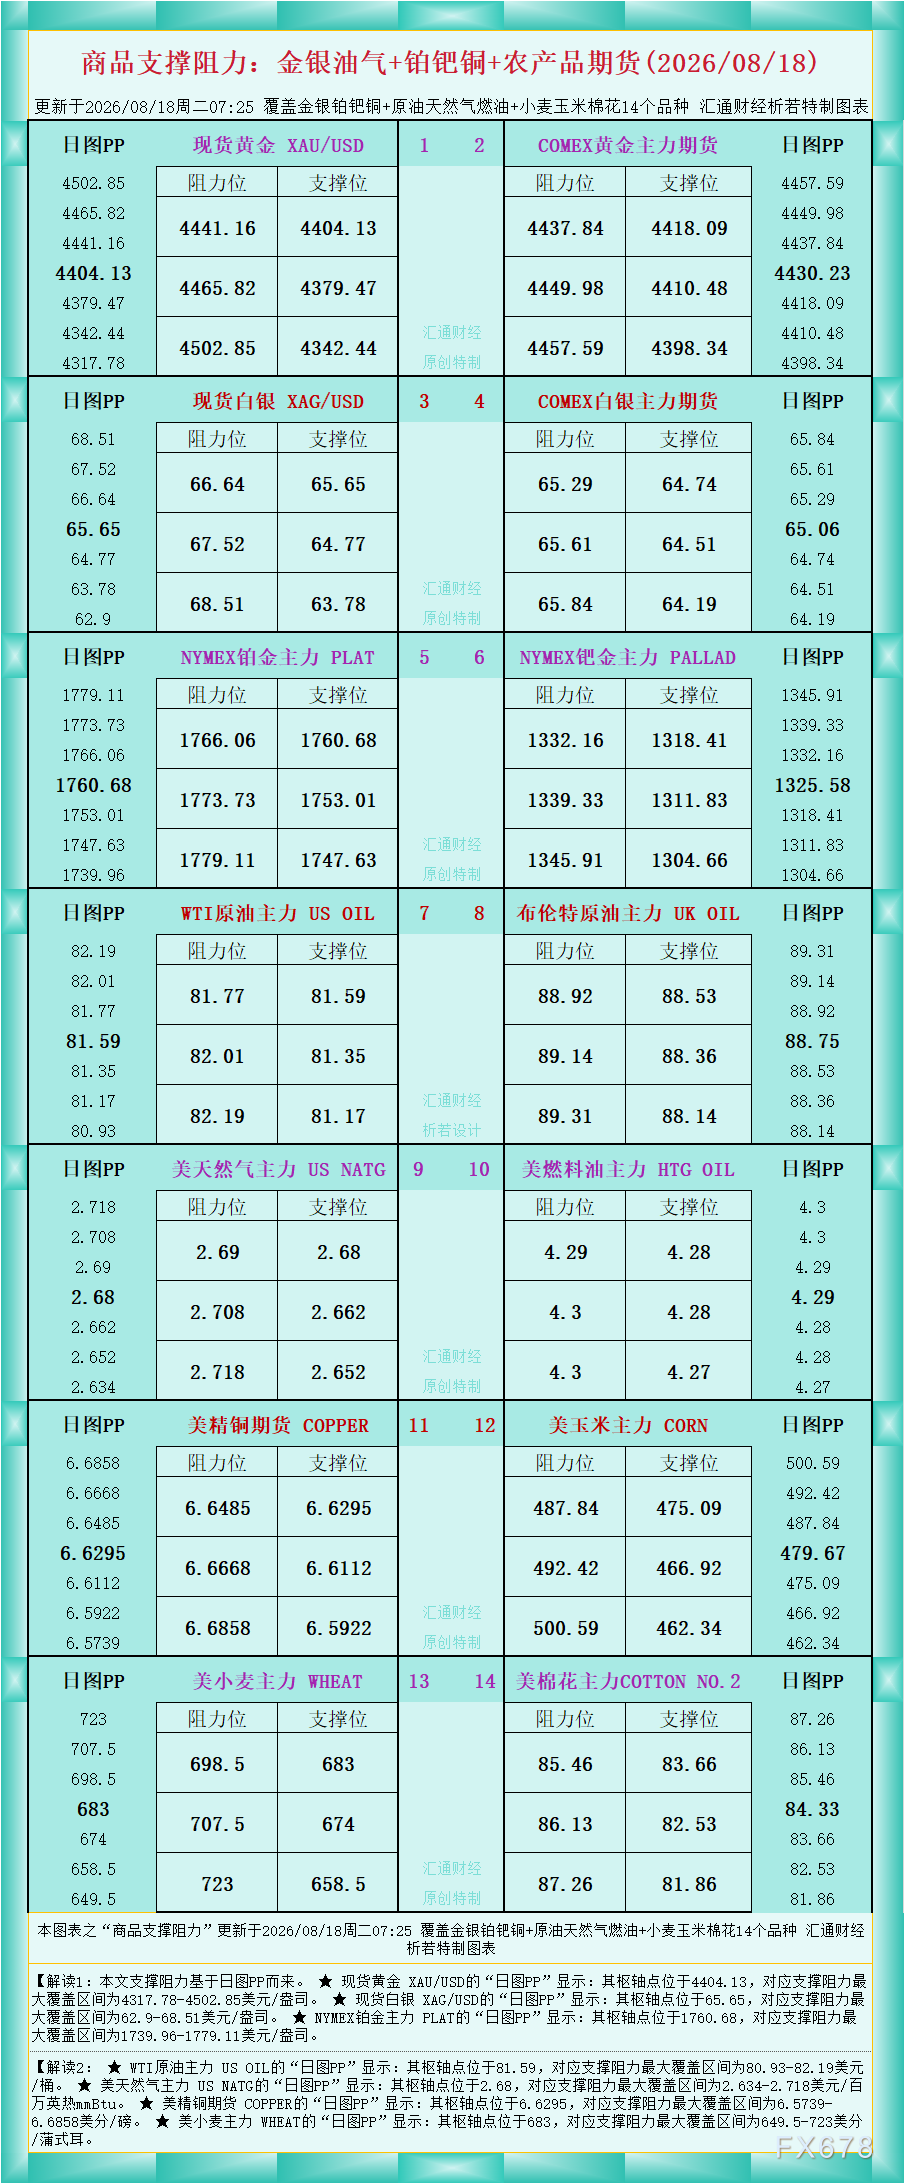
According to the chart data, Interpretation 1: The support and resistance in this article are based on the daily chart PP levels.
★ The daily chart PP for spot gold XAU/USD shows: its pivot is at 4404.13, with a maximum support and resistance range of 4317.78-4502.85 USD/oz.
★ The daily chart PP for spot silver XAG/USD shows: its pivot is at 65.65, with a maximum support and resistance range of 62.9-68.51 USD/oz.
★ The daily chart PP for NYMEX Platinum main contract PLAT shows: its pivot is at 1760.68, with a maximum support and resistance range of 1739.96-1779.11 USD/oz.
Interpretation 2:
★ The daily chart PP for WTI Crude main contract US OIL shows: its pivot is at 81.59, with a maximum support and resistance range of 80.93-82.19 USD/barrel.
★ The daily chart PP for US Natural Gas main contract US NATG shows: its pivot is at 2.68, with a maximum support and resistance range of 2.634-2.718 USD per million British thermal units (mmBtu).
★ The daily chart PP for US Copper futures COPPER shows: its pivot is at 6.6295, with a maximum support and resistance range of 6.5739-6.6858 cents/pound.
★ The daily chart PP for US Wheat main contract WHEAT shows: its pivot is at 683, with a maximum support and resistance range of 649.5-723 cents/bushel.
For interpretation of more varieties, refer to the chart.
Disclaimer: The content of this article solely reflects the author's opinion and does not represent the platform in any capacity. This article is not intended to serve as a reference for making investment decisions.
You may also like
United States Dollar Index holds ground on safe-haven demand
First U.S. investment project changes? U.S. reportedly pressures Samsung and SK Hynix to build memory factories in the U.S.; South Korea urgently denies but refuses to disclose details
The South Korean presidential office Blue House has recently denied a local media report claiming that the government is in discussions with the United States to make a semiconductor project the first investment under its 350 billions USD investment commitment to the US.

Wilton Resources seeks to lift SGX trading halt in shares (5F7)
UMT sees 2027 revenue at EUR 1.2 million-EUR 1.5 million
Crypto prices
More


