
web3: XLM falls below key support, derivatives data weakens

Stellar token XLM remained under pressure on Tuesday, weakening further after a slight pullback in the previous trading session. The market focus has shifted from a short-term rebound to downside support, as multiple derivatives indicators have simultaneously weakened, signaling traders’ bearish expectations for the future.
Long-short ratio falls below 1
Latest data shows that XLM's long-short ratio has dropped to 0.90, nearing its lowest point in over a month. A long-short ratio below 1 means there are more short positions than long positions, with more traders betting on continued price declines.
In addition to the falling long-short ratio, XLM's funding rate has also turned negative. This typically indicates that short interest in perpetual contract markets is stronger than long interest. Meanwhile, open interest is rising, reflecting that new positions are entering the market, with the current direction leaning towards the short side.
- XLM long-short ratio falls to 0.90
- Funding rate turns negative
- Open interest increases
$0.166 becomes short-term resistance
From a price standpoint, XLM traded near $0.161 on Tuesday, having already broken below both short-term and mid-term exponential moving averages. The prior breakout point of the downward trendline was around $0.166, which has now turned into short-term resistance.
The Relative Strength Index (RSI) is around 35, indicating weak buying momentum, but it has not yet entered the typical oversold zone. The MACD remains below the zero axis, also suggesting current momentum is weak, and the market has not yet shown clear signs of reversal.
If XLM attempts to stabilize, it will first need to regain the $0.166 level. If this level is effectively recovered, the price will have a chance to further test the horizontal resistance near $0.177.
Focus on $0.142 below
The higher resistance area is concentrated between $0.178 and $0.181, corresponding to the 50-day and 100-day exponential moving averages. If the rebound continues, the 200-day exponential moving average at $0.193 will become an even more important level to watch.
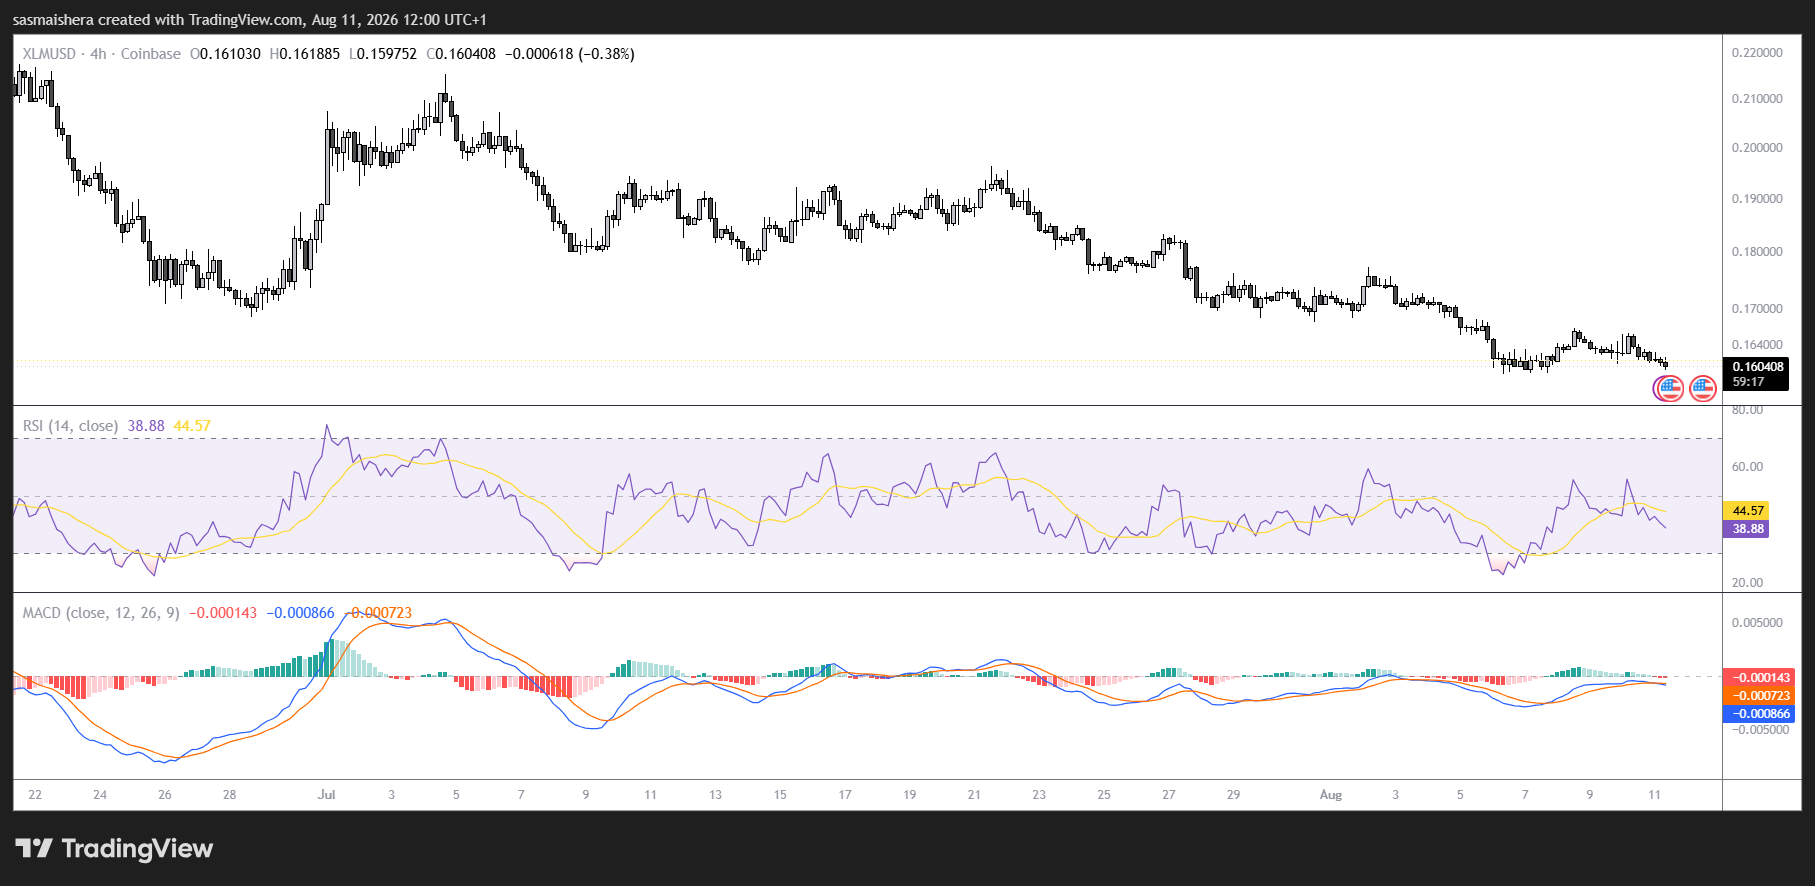
On the downside, the main support level the market currently focuses on is at $0.142. If this level is breached, the current decline may further accelerate, and the price may continue searching for new interim support.
Disclaimer: The content of this article solely reflects the author's opinion and does not represent the platform in any capacity. This article is not intended to serve as a reference for making investment decisions.
You may also like
Nvidia quietly reduces OpenAI data center guarantee from 250 billions to below 120 billions
Nvidia and OpenAI are close to signing a data center financing agreement in Ohio. However, Nvidia's financial guarantee has been reduced from $250 billion to less than $120 billion, covering only about 5 GW of computing power for the project's first phase. This adjustment is a direct response to investor concerns about Nvidia's risk exposure—after the previous $250 billion guarantee plan was revealed, Nvidia's stock price fell 5% in a single day. The agreement could be signed as early as this weekend.

Ivy League’s space gamble: Harvard reveals $2.2 billions SpaceX position, its largest single stock holding
Harvard University Investment Management Company disclosed that it holds $2.2 billion worth of SpaceX shares, making it the largest single stock position in its $4.3 billion US equity portfolio. This holding originated from Harvard’s early investment in SpaceX through venture capital funds, and the position has significantly appreciated after SpaceX’s public listing in June this year. The University of California also disclosed a roughly $1 billion position in SpaceX during the same period. Over the past decade, endowment funds from several universities have made substantial bets on private tech assets.
Crypto prices
More


