

Ethereum price outlook has turned more optimistic, with technical indicators flashing rare buy signals and institutional inflows rising. Analysts are increasingly focusing on the $2,000 level as a critical milestone, with potential for further advances toward $3,000 if key resistance points are overcome.
Ethereum’s TD Sequential signals spark $3,000 target as ETFs see $255.6 million inflows
By:Cointurk
Bitget offers one-stop trading for cryptocurrencies, stocks, and gold. Trade now!
A welcome pack worth 6200 USDT for new users! Sign up now!
PAY
USDT
RECEIVE
AAPL
Technical signals highlight bullish potential
$2,000 acts as immediate technical hurdle
ETF inflows and volatility trends support price setup
Technical signals highlight bullish potential
The monthly TD Sequential indicator, used to spot trend exhaustion and potential market reversals, has signaled two buy opportunities for Ethereum, noted Ali Charts, a prominent crypto market analyst. These included a black 9 setup and an S13 countdown pattern on Ethereum’s monthly chart.
Historically, the TD Sequential’s major signals have often preceded notable market moves. For example, a sell signal in April 2022 came just before Ethereum entered a steep decline of around 75%, while a black 9 signal in September 2022 was followed by a sharp price rally of 236%.
Ali Charts highlighted the TD Sequential’s recent performance: Past buy signals have led to significant rallies, including a 258% rise after an A13 signal in April 2025. With the latest setup in play, Ethereum’s path to $3,000 is in focus if confirmation emerges.
Currently, Ethereum trades near $1,625. Achieving the $3,000 target would require a gain of roughly 85%. However, analysts have cautioned that the TD Sequential indicates only possible trend exhaustion, not a guaranteed rebound. Further confirmation through price action, such as higher lows and reclaimed resistance, is still necessary.
Mini dictionary: TD Sequential, a technical analysis tool developed by Thomas DeMark, identifies potential trend exhaustion by using a nine-bar Setup and a 13-bar Countdown to suggest possible market turning points.
$2,000 acts as immediate technical hurdle
Michaël van de Poppe, a well-known cryptocurrency analyst, has identified the $1,800 to $2,000 range as a crucial battleground for Ethereum’s short-term price trend. He described $1,800 as vital support, while a clear move above $2,000 could signal the onset of a stronger rally.
Van de Poppe’s latest chart places ETH near $1,915, with initial support around $1,825 and resistance emerging at approximately $2,465. If buying momentum continues beyond that point, additional resistance is seen between $2,500 and $2,600.
For Ethereum to seriously challenge the $3,000 level, analysts indicate it must first secure a breakout above $2,000 and then clear several higher resistance thresholds.
Level Type Status
| $1,800 | Support | Critical base |
| $2,000 | Breakout point | Immediate hurdle |
| $2,300-$2,600 | Resistance | Technical barrier |
| $3,000 | Upside target | Potential if confirmed |
ETF inflows and volatility trends support price setup
Options data shows that volatility in Ethereum’s price has decreased during recent consolidation, as measured by Glassnode’s DVOL Index, which registered 47.44 on August 7 after running above 50 for much of July. Lower volatility typically suggests expectations for a more stable price range in the near term.
Meanwhile, U.S. spot Ethereum exchange-traded funds (ETFs) recorded net inflows of $255.6 million from August 4 through August 7, according to Farside Investors. This steady influx of institutional capital could lend further support as technical signals gain wider attention.
With rising institutional investment and historically rare technical setups, market attention is focused on whether Ethereum can achieve a confirmed break above $2,000 and make progress toward the longer-term $3,000 target.
0
0
Disclaimer: The content of this article solely reflects the author's opinion and does not represent the platform in any capacity. This article is not intended to serve as a reference for making investment decisions.
Understand the market, then trade.
Bitget offers one-stop trading for cryptocurrencies, stocks, and gold.
Trade now!
You may also like
The Wall Street "Stock Picking Myth" Continues to Fade: Only 13% Outperformed the Index in the Past Decade
According to the latest data from Morningstar, in the ten years up to the end of June 2026, only 13% of actively managed large-cap U.S. equity funds outperformed their benchmark indexes after fees, and even in the past year, this proportion was only 27%. Meanwhile, net inflows into passive ETFs this year are expected to surpass $1 trillion for the first time, and the asset size of passive funds is now nearly twice that of active funds.
华尔街见闻•2026/08/16 09:51
Shiba Inu burn rate jumps 2,842% in 24 hours as Shibarium activity grows
Cointurk•2026/08/16 09:30
Zcash trades near $490 as traders eye $500 resistance and $425 support
Cointurk•2026/08/16 09:21
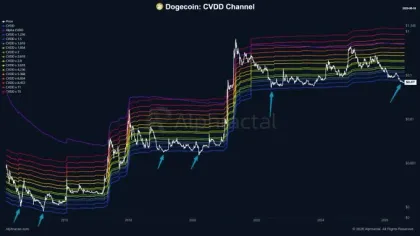
Dogecoin’s rare setup mirrors 2022 – Can DOGE repeat its 140% rally?
AMBCrypto•2026/08/16 09:06
Crypto prices
More
Bitcoin
BTC
$62,913.66
-0.08%

Ethereum
ETH
$1,878.84
+0.04%

Tether USDt
USDT
$0.9989
-0.01%

USDC
USDC
$0.9998
-0.01%

XRP
XRP
$0.9999
-0.10%

Solana
SOL
$75.25
+0.17%

TRON
TRX
$0.3309
-0.36%

Hyperliquid
HYPE
$57.33
+2.22%

Dogecoin
DOGE
$0.06972
-0.36%

Zcash
ZEC
$486.92
-0.28%
How to buy BTC
Bitget lists BTC – Buy or sell BTC quickly on Bitget!
Trade now
Become a trader now?A welcome pack worth 6200 USDT for new users!
Sign up now