
A chart of commodity support and resistance: gold, silver, oil, gas + platinum, palladium, copper, and agricultural futures (July 27, 2026)

Huizhou Finance July 27th News—— One chart to view commodity support and resistance: gold, silver, oil & gas + platinum, palladium, copper + agricultural futures, updated at 11:35 am Monday, July 27, 2026 (UTC+8). Specifically covering 14 varieties including gold, silver, platinum, palladium, copper + crude oil, natural gas, fuel oil + wheat, corn, and cotton. For more details, please refer to the special chart in Huizhou Finance Analysis.
One chart to view commodity support and resistance: gold, silver, oil & gas + platinum, palladium, copper + agricultural futures, updated at 11:35 am Monday, July 27, 2026 (UTC+8). Specifically covering 14 varieties including gold, silver, platinum, palladium, copper + crude oil, natural gas, fuel oil + wheat, corn, and cotton. For more details, please refer to the special chart in Huizhou Finance Analysis.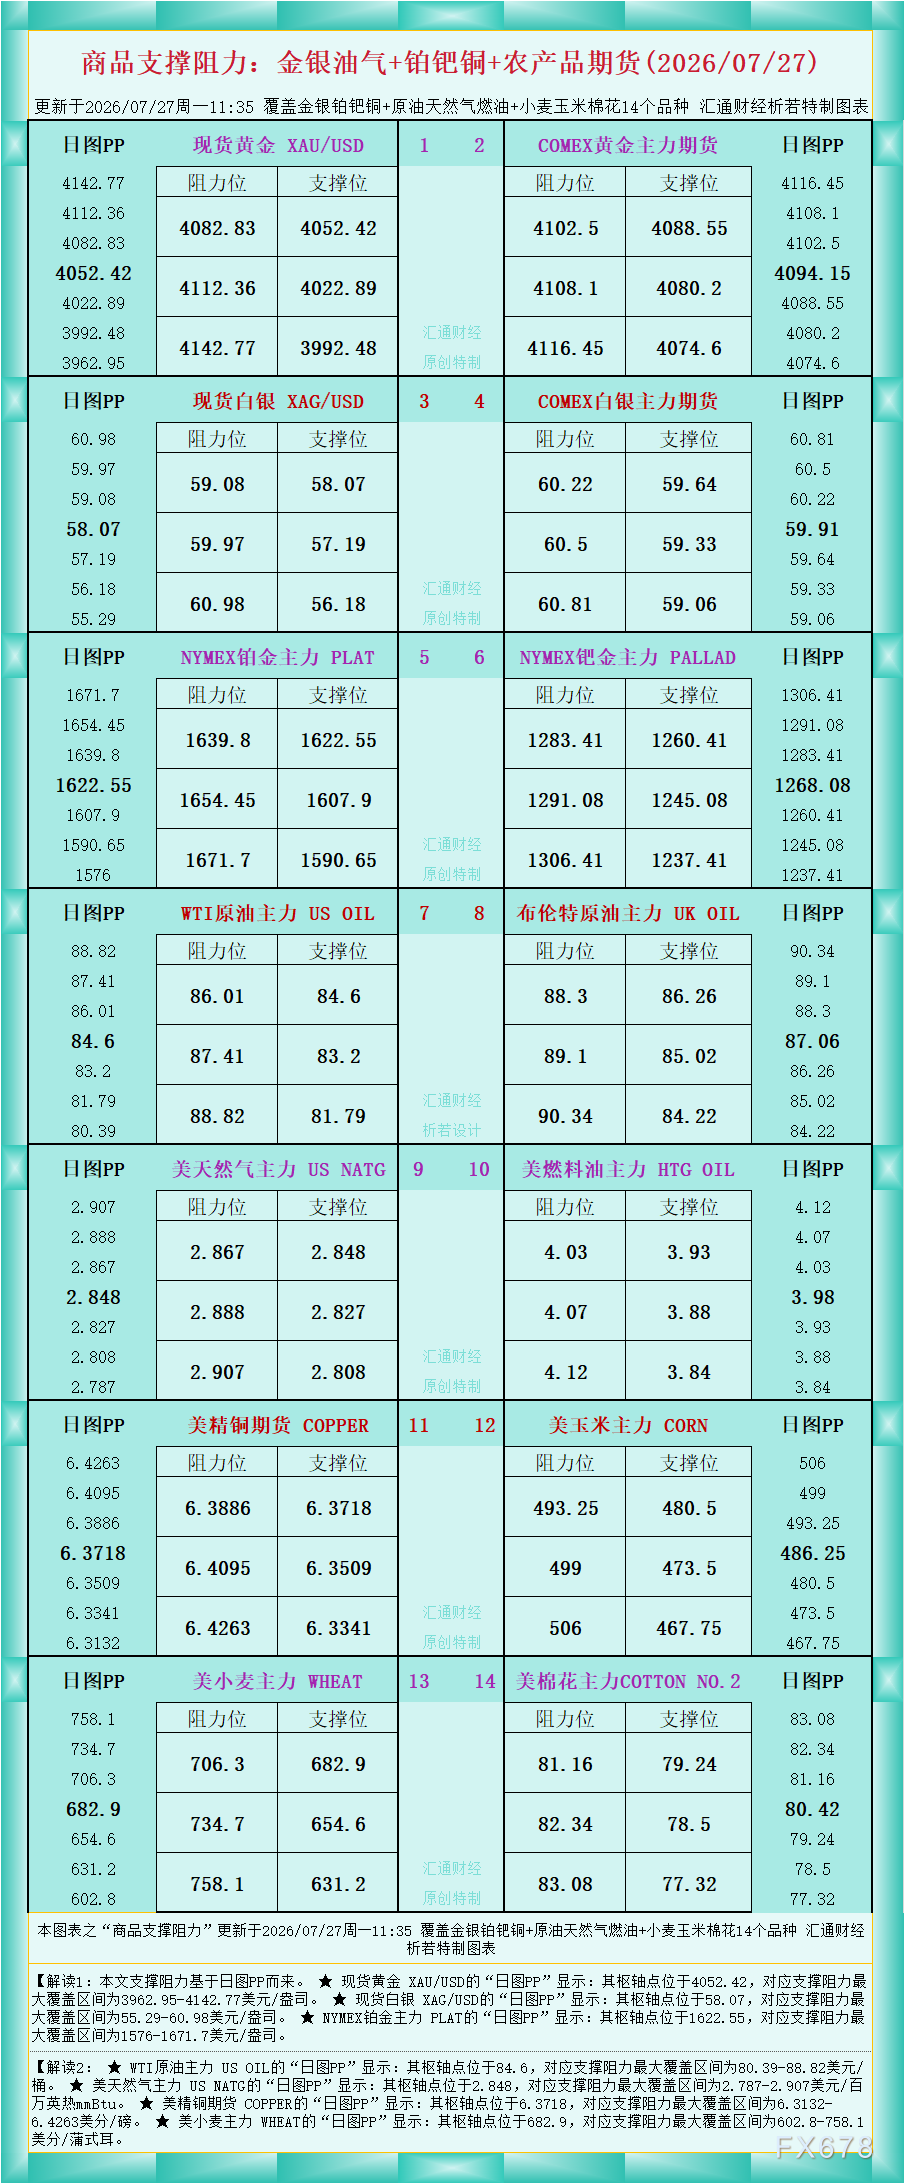
As the chart data shows, Interpretation 1: The support and resistance in this article are based on the daily PP.
★ For spot gold XAU/USD, the “daily PP” shows: the pivot point is at 4052.42, with the maximum support and resistance range between 3962.95 and 4142.77 USD/oz.
★ For spot silver XAG/USD, the “daily PP” shows: the pivot point is at 58.07, with the maximum support and resistance range between 55.29 and 60.98 USD/oz.
★ For NYMEX platinum main contract PLAT, the “daily PP” shows: the pivot point is at 1622.55, with the maximum support and resistance range between 1576 and 1671.7 USD/oz.
Interpretation 2:
★ For WTI crude oil main contract US OIL, the “daily PP” shows: the pivot point is at 84.6, with the maximum support and resistance range between 80.39 and 88.82 USD/barrel.
★ For US natural gas main contract US NATG, the “daily PP” shows: the pivot point is at 2.848, with the maximum support and resistance range between 2.787 and 2.907 USD/MMBtu.
★ For US copper futures COPPER, the “daily PP” shows: the pivot point is at 6.3718, with the maximum support and resistance range between 6.3132 and 6.4263 cents/lb.
★ For US wheat main contract WHEAT, the “daily PP” shows: the pivot point is at 682.9, with the maximum support and resistance range between 602.8 and 758.1 cents/bushel.
For more interpretations on other varieties, please refer to the chart.
Disclaimer: The content of this article solely reflects the author's opinion and does not represent the platform in any capacity. This article is not intended to serve as a reference for making investment decisions.
You may also like

Crypto market’s weekly winners and losers – WLD, WLFI, UNI, ADA
Tokenized stocks reach 1.4M holders, up 448% in six months
web3: Crypto Market Valuations Shift Towards Revenue and Real Usage Data

Crypto prices
More


