
One Chart: Overview of "Pivot Points + Long/Short Position Signals" for Gold, Crude Oil, Forex, and Stock Indexes on July 22, 2026

Huitong Network, July 22 — This is the latest installment in the "One Chart" series, presenting the most recent "pivot points + long/short position signals" for gold, crude oil, forex, and stock indices, including both chart and textual interpretations. By comparing the latest net-long % with the % from the previous update (the prior trading day net-long %), a total of 13 types of position signals are interpreted, such as: expansion of net-long, reduction of net-long, no change in net-short, net-short turning to long/short balance, etc. Depending on the actual data comparison results, several of these signals are displayed accordingly.
One Chart: Overview of "Pivot Points + Long/Short Position Signals" for Gold, Crude Oil, Forex, and Stock Indices on July 22, 2026. The latest data released today (Wednesday, July 22, 2026), shows that as of now, among the instruments in this chart, those currently in an "overbought" state (long positions over 80%) are: 4 varieties; those in an "oversold" state (long positions less than 20%) are: 3 varieties. Among them, the highest proportion of long positions is in the US dollar vs. offshore Chinese yuan USD/CNH. Spot gold XAU/USD has a long position ratio of 23%, US crude oil WTI OIL at 71%, euro vs. US dollar EUR/USD at 76%. For the specific changes in signals for these varieties compared to the previous update, as well as more details, see the specially prepared chart by Huitong Finance.
Among the changes in positions, net-long expansions are observed in 4 instruments, net-long reductions in 7, and net-short expansions in 2. Varieties with a position ratio of 80% and above include: S&P 500 Index with a long position ratio as high as 82%, Germany DAX40 GERMANY 40 short position at 84%, euro vs. Australian dollar EUR/AUD long position at 85%, pound vs. yen GBP/JPY long position at 89%, and New Zealand dollar vs. yen NZD/JPY short position at 94%.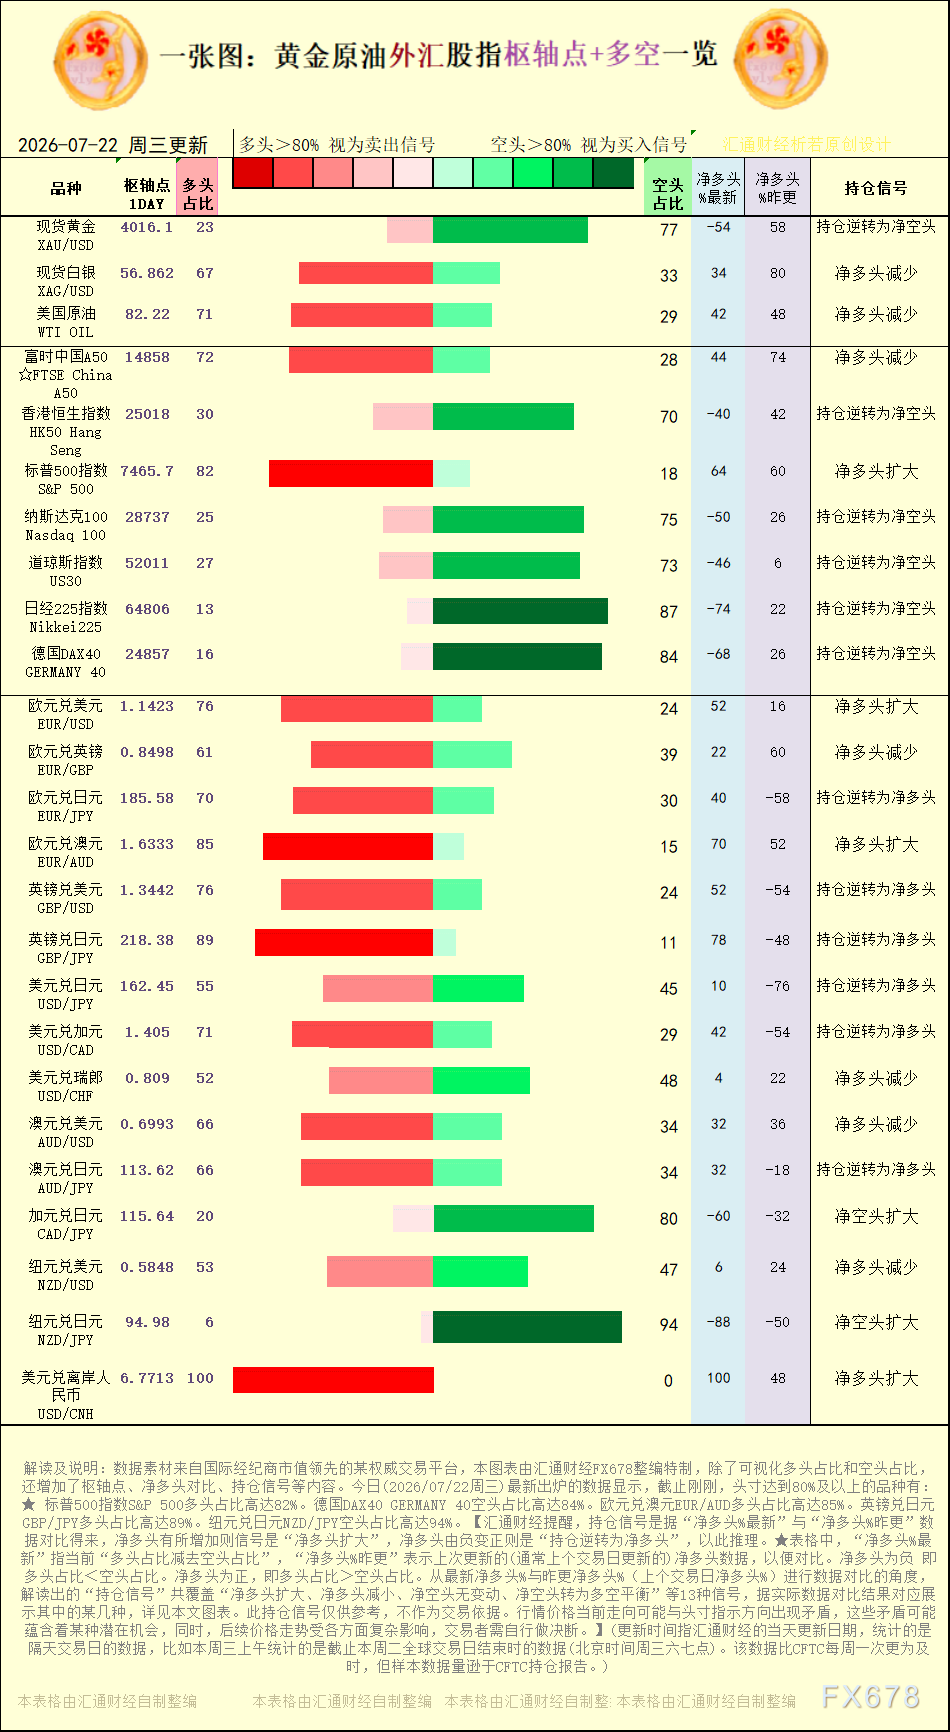
[Image: Pivot points and Long/Short Position Signals interpretation for gold, crude oil, forex, and stock indices, source: Special chart by Huitong Finance. (Click the image to enlarge)]
Net-long expansions are seen in: S&P 500 Index, euro vs. US dollar EUR/USD, euro vs. Australian dollar EUR/AUD, US dollar vs. offshore Chinese yuan USD/CNH. Net-long reductions occurred in: spot silver XAG/USD, US crude oil WTI OIL, FTSE China A50, euro vs. pound EUR/GBP, US dollar vs. Swiss franc USD/CHF, Australian dollar vs. US dollar AUD/USD, and New Zealand dollar vs. US dollar NZD/USD.
Huitong Finance reminds that position signals are derived by comparing the "latest net-long %" and the "net-long % last update": if the net-long increases, the signal is "net-long expansion"; if the net-long turns from negative to positive, it is a "position reversal to net-long," and so forth. In the table, "latest net-long %" refers to the difference between current long and short proportions, while "net-long % last update" refers to the previous (typically prior trading day's) net-long data for easy comparison. Negative net-long means long positions short positions. Comparing the latest and previous net-long %, a total of 13 interpreted signals such as "net-long expansion, net-long reduction, no change in net-short, net-short turning to balance," etc., are covered; several of these are displayed according to the actual comparison results (see the chart in this article for details). Current market prices and position indicator directions may appear contradictory, which could imply some latent opportunity; however, future price trends are subject to various complex influences, so traders should exercise their own judgment.
[Instruments covered in this chart: Spot gold, spot silver, US crude oil, FTSE China A50, Hang Seng Index, S&P 500 Index, Nasdaq 100, Dow Jones Index, Germany DAX40, euro vs. US dollar, euro vs. pound, euro vs. yen, euro vs. Australian dollar, pound vs. US dollar, pound vs. yen, US dollar vs. yen, US dollar vs. Canadian dollar, US dollar vs. Swiss franc, Australian dollar vs. US dollar, Australian dollar vs. yen, Canadian dollar vs. yen, New Zealand dollar vs. US dollar.]
Disclaimer: The content of this article solely reflects the author's opinion and does not represent the platform in any capacity. This article is not intended to serve as a reference for making investment decisions.
You may also like
Optical communication ODM leader Fabrinet (FN.US) Q4 revenue increased by 45% year-on-year to a record high, data center revenue share surpassed 50% for the first time, but shares plunged nearly 7% after hours
After the U.S. stock market closed on Monday, Fabrinet, the largest ODM manufacturer in the optical communications industry, announced its financial results for the fourth quarter of fiscal year 2026, which ended in late June.

29 states join forces! Meta (META.US) accused of "inducing addiction", faces up to $1.4 trillion in penalties
Meta is facing a jury trial in federal court after being accused of intentionally designing Facebook and Instagram to encourage addiction among young users.

EURC surpasses €400M in circulation, marking euro liquidity milestone
Compound bets $52M on institutional pivot as COMP jumps 10%
Crypto prices
More


