
Deep Update on HBM Export: Samsung Estimated at $6.7 Billion in 2Q26, Is HBM4 Really Catching Up in Speed?

TL;DR
1.Samsung Electronics' marginal changes are strong enough to warrant a reassessment.In June 2026, South Korea's multi-chip memory exports to Taiwan and Malaysia amounted to about $6.2 billion, up 45% month-on-month and rising 46% compared to March; the combined Q2 growth was 39%. With Chungcheongnam-do as a proxy for Samsung Electronics' backend packaging activities, its Q2 exports increased by 75% QoQ. Based on Bernstein's regression, Samsung’s HBM revenue for the quarter was about $6.7 billion, up 89% sequentially, and 25% higher than the original model’s $5.4 billion.
2.But “catching up faster” is not the same as “surpassing” just yet.The same calculation puts SK Hynix’s Q2 HBM revenue at approximately $7.6 billion, a 25% increase QoQ, still higher than Samsung’s $6.7 billion. Samsung leads in growth and exceeding expectations, while SK Hynix leads in absolute scale and visibility. In June, Samsung’s single month exports surpassed SK Hynix for the first time—this only proves a change in marginal slope, not a shift in quarterly leadership.
3.The best clue for HBM4 ramping up—also the easiest to misinterpret—is export value per unit weight.In June, Samsung’s proxy value per unit weight rose 30% MoM and about 70% since April, while SK Hynix was roughly flat. This supports “a higher share of high-value products” but alone cannot prove all increases came from HBM4, nor directly translate into average prices or shipment volume.
4.Malaysia is shifting from a peripheral destination to a new observation line.June exports were about $1.1 billion, up 231% MoM, driven mainly by Samsung proxy sources. This may reflect advanced packaging and customer path diffusion, or include inventory build-up, batch deliveries, and quarter-end shipment concentration. Without supporting customer, capacity, or follow-up monthly data, a one-month surge cannot be written as a long-term share.
5.The most valuable investment angle is decomposing the earnings sources of all four companies.Samsung Electronics enjoys both HBM share recovery and price increases in traditional DRAM/NAND; SK Hynix still offers the largest, most secure HBM exposure; Micron benefits from industry supply-demand but can’t be directly verified through Korean exports; Kioxia is more related to the NAND cycle, and HBM logic can't simply be applied.
Table of ContentsJoin the Knowledge Planet to access the complete original report and reference research papers
- What June data really changed
- Why $6.7 billion is useful, and why it shouldn’t be used as an earnings figure
- Per-unit-weight value: HBM4 signal or statistical illusion
- Malaysia: Is a second packaging route in formation?
- What’s missing in this model
- 6. Remaining Sections
June’s export data shifts Samsung’s HBM catch-up from narrative to quantitative validation, but $6.7 billion is still a regression-based estimate; what really needs tracking is the HBM4 product mix, customer routes, and Q3 continuity.
What June data really changed
This report provides an observation window earlier than earnings and more continuous than industry rumors, and is more valuable than simply confirming that “HBM demand is great.”Korean customs data is updated monthly. Bernstein treats multi-chip memory exports to Taiwan and Malaysia as a proxy for HBM, and then divides by origin: Chungcheongnam-do maps to Samsung Electronics, while Chungcheongbuk-do and Icheon City map to SK Hynix.
The standout figure for June is Samsung’s proxy exports of about $3.4 billion, nearly double May’s number; Q2 exports rose 75% QoQ overall.More importantly, June accounted for 55% of Samsung Electronics’ proxy exports for the quarter, and for the first time since ramping up HBM exports in early 2024, Samsung surpassed SK Hynix in a single month. The prior debate was whether Samsung’s HBM4 was “sampling progress” or “solid revenue realization”—these figures at least show that by the end of Q2, Samsung had truly accelerated its high-value memory shipments.
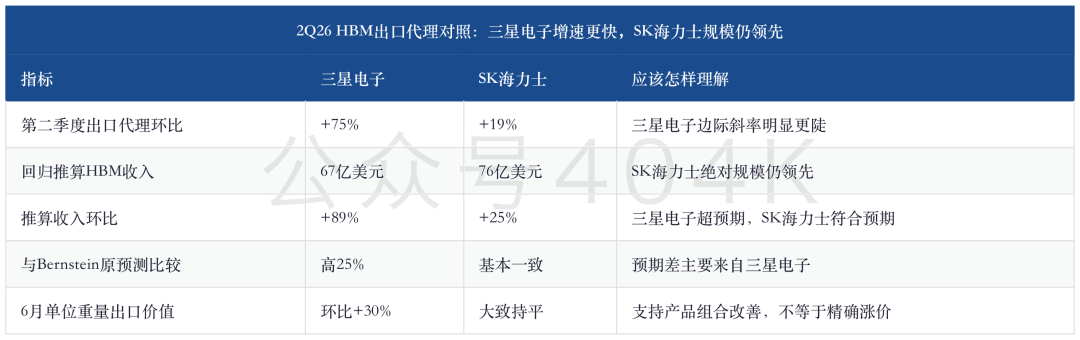
Two issues need to be distinguished here.The first is “who’s growing faster;” the answer clearly leans toward Samsung Electronics. The second is “whose HBM business is bigger and more stable;” this season’s proxy data still favors SK Hynix. Confusing these two blurs a strong catch-up for Samsung into an outright industry leadership shift which hasn’t happened yet.
Why $6.7 billion is useful, and why it shouldn’t be used as an earnings figure
Bernstein’s regression is not an arbitrary extrapolation.With a longer historical sample, the fit between Samsung Electronics’ export proxy and HBM revenue reaches 0.9573; using only data from Q1 2025 onward, the fit rises to 0.979, and both samples yield about $6.7 billion. The SK Hynix model’s fit is 0.9838, calculating about $7.6 billion. High fit suggests this metric is good for directional income expectations for the quarter, especially for capturing pre-earnings surprises.
But a high correlation doesn’t mean revenue equivalence.Export values are simultaneously affected by product mix, pricing, delivery timing, destinations, and packaging paths, and historical relationships can change when products shift to a new generation. For Q2, Samsung’s exports were heavily back-loaded, with 55% in June; if that includes quarter-end batch shipments, customer acceptances, or inventory transfers, regression methods may exaggerate these short-term swings into a revenue slope.
A more accurate statement would be:$6.7 billion is a high-quality “real-time quarterly income forecast,” not Samsung Electronics’ disclosed HBM revenue.It’s sufficient for raising expectations, but not enough alone to prove that HBM4 yields, customer share, and sustainable profitability have reached their targets.
Per-unit-weight value: HBM4 signal or statistical illusion
HBM has much higher per-unit-weight value than conventional memory products.Samsung Electronics’ proxy measure was up 30% MoM in June, about 70% since April, with SK Hynix’s figure roughly flat or down. Bernstein thus judges the change at Samsung is likely from an increased HBM4 share, not a general HBM-wide price hike. That’s logical: if both companies’ indicators rose together, it would point to industry-wide pricing; now with only Samsung elevating sharply, product mix change (not uniform price hikes) better explains the divergence.
But this indicator only tells us “the export value per unit weight went up,” not whether it was from a higher generation, more stack layers, new packaging structure, or a change in customers/destinations.It also doesn’t mean SK Hynix is not making HBM4 progress. Industry materials have already shown SK Hynix completed HBM4 development and ramped a mass production system, so their flat proxy indicator could reflect shipping routes, product mix, or base effects.
Therefore, per-unit-weight value is the strongest directional evidence here, but not the strongest quantitative proof.The correct approach is to consider it alongside Samsung’s export value, customer verification, management guidance, and future quarterly revenue. The wrong approach is to use just this curve to calculate HBM4 shipments or to declare a total supplier position reversal.
Malaysia: Is a second packaging route in formation?
Taiwan is still the main destination, averaging around $3.5 billion in monthly exports over the past six months; Malaysia is about $550 million, just a fraction.But in June Malaysian exports suddenly rose to about $1.1 billion, up 231% MoM, mainly from Samsung-related proxies. This makes Malaysia shift from “supplementary data” to a variable that needs ongoing tracking.
Bernstein connects this trend to Intel's advanced packaging routes. Logically, it’s possible: HBM doesn’t only move along a single accelerator and packaging ecosystem, customer diffusion brings new packaging locations.However, the report itself raises a key question: if major customer adoption is still one or two years away, why has export volume already risen sharply ahead of time?
This is precisely the most worthy contradiction to keep in mind in this study.Possible explanations include inventory build-up, engineering validation, small-batch packaging, quarter-end batch shipments, or that the destination is only a logistics node and not a final customer. To escalate a “Malaysia jump” into a “second mass production route” will require at least two out of three in the next 2–3 months: continued elevated levels, advanced local packaging capacity ramp, and synchronized downstream customer procurement pace.
What’s missing in this model
There are at least two inherent blind spots for export proxies.First, if HBM backend packaging is completed outside Korea, the Korean customs product and origin data may not fully reflect supplier revenue. Second, if HBM is assembled into higher-level products within Korea before export, discrete multi-chip memory exports could be under-counted. The more advanced packaging capacity is built in Korea, the more the second problem needs attention.
Additionally, the report shows that conventional DRAM and NAND prices have risen significantly, while SK Hynix’s HBM unit weight value has remained roughly in its previous range.This indicates that the two pricing cycles are not synchronized: traditional memory is more driven by spot supply-demand and inventory cycles, while HBM is dictated by annual contracts, customer certification, and generational product features. For 2027 profitability, the true new variable is not how much traditional memory prices have already risen, but whether HBM repricing can turn that scarcity and performance upgrade into higher contract prices.
You can join Knowledge Planet to view the remaining 30% of the article. The full original and the reference reports have already been posted there—welcome to join.
Disclaimer: The content of this article solely reflects the author's opinion and does not represent the platform in any capacity. This article is not intended to serve as a reference for making investment decisions.
You may also like
Japan’s Economy Unexpectedly “Hits the Brakes”! Q2 GDP Grows Only 1.1% While 10-Year JGB Yield Surges to 30-Year High
Japan's economic growth unexpectedly slowed in the three months ending in June, a result that could make policy communication more complicated for the Bank of Japan as it weighs the timing of its next rate hike.

A critical moment for capital has arrived? AI narrative shifts from technology to financing, major players face cash flow crises, and warning signs emerge in the bond market
Bridgewater warns of a "critical moment for capital." Morgan Stanley predicts that by 2028, approximately $1.75 trillion in AI construction funding will be raised from credit markets. However, risks have emerged: Oracle's CDS surged to 180 basis points, and free cash flow is nearing -$40 billion. The "new Bond King" Gundlach bluntly stated that issuing long-term bonds backed by GPUs is no different from "using bananas to create 30-year ABS."
The Super Copper Cycle Remains Elusive: BHP Faces Cooling Bullish Sentiment Ahead of Earnings, Analysts Abandon Bullish Outlook
Analysts' bullish sentiment towards BHP (BHP.US) has cooled ahead of the company's annual results announcement on Tuesday.

Crypto prices
More


