
Semiconductor Equipment Deep Dive: Each Additional 1GW Requires 50,000 Monthly Capacity, How AI Will Push WFE Towards $300 Billion

TL;DR
1.Bernstein provides a quantifiable bridge from electric power to profitability.For each additional 1GW annual data center construction capacity, about 46,000 pieces/month of new 300mm equivalent wafer capacity are required, rounded to approximately 50,000 pieces/month; based on equipment capex intensity for different nodes, each 1GW roughly corresponds to $7.5–8 billion in new wafer fab equipment (WFE) spending.
2.The 50GW scenario means an annual increase in capacity in 2030 is 50GW higher than the 2026 baseline.The 2026 baseline is around 20GW, so annual new capacity in 2030 is about 70GW; cumulative data center expansion from 2027 to 2029 could reach 130 to 140GW, well above 50GW. Wafer fab equipment must be ordered, installed, and validated in advance.
3.$300 billion comes from "AI incremental + non-AI baseline," not just a slogan.The 50GW scenario corresponds to $376 billion in incremental AI WFE from 2027 to 2029, adding a 3-year $360 billion non-AI baseline, totaling about $736 billion; the annual breakdown is about $200 billion, $245 billion, and $291 billion. More precisely, $300 billion is approached in 2029, not as a 3-year average.
4.89% of incremental wafers come from memory, making Applied Materials Bernstein's top pick.For each 1GW in demand, DRAM accounts for 53%, NAND for 20%, HBM for 16%, and advanced logic only 11%. The AI hardware cycle is not just about GPUs and advanced logic; external rack CPUs and their paired DRAM represent the largest increase in wafers in this model.
5.Whether share prices can continue to rise depends on earnings catching up to valuations, not just WFE totals.In the 50GW scenario, 2029 EPS is projected 59.5%, 54.4%, and 37.1% higher than the consensus for Applied Materials, Lam Research, and KLA respectively, corresponding to PEs of 14.9x, 18.4x, and 21.2x; the 75GW and 100GW cases are more optimistic stress tests. Any weakness in project power acquisition, installed facility power, chip energy efficiency, memory content, equipment delivery, or inventory cash flow could discount these scenarios.
ContentsJoin Knowledge Planet to view the full original report and reference research documents
- The real dilemma for equipment stocks: prices have pulled back, but valuations aren't cheap
- From 1GW to 46,000 wafers monthly—how does the model work?
- 50GW is not cumulative build, and $300 billion is not a three-year average
- Why this wave of equipment demand is led by memory, not advanced logic
- How to recalculate for Applied Materials, Lam Research, and KLA in 50, 75, and 100GW scenarios
- 6. Remaining Chapters
Bernstein translates the expansion of AI data center electricity into wafer and equipment demand: what truly determines the cap for equipment stocks is whether GW projects can be converted into monthly capacity, orders, and cash flow.
The real dilemma for equipment stocks: prices have fallen, but valuations aren't cheap
Semiconductor equipment stocks now exhibit both "deep pullbacks" and "strong gains"—seemingly contradictory facts.As of July 17, 2026 (as used in Bernstein’s report), ASML, Tokyo Electron, Applied Materials, Lam Research, and KLA on average saw prices pull back 23.9% from their respective 52-week highs, with three US companies down about 28%–31%; however, these five have still risen an average of 84.1% year to date, with individual stocks gaining 67%–106%.
Valuation expansion hasn’t disappeared with the pullback, either.The report shows KLA and Lam Research’s forward 12-month PEs have risen from around 28x and 27x at the start of the year to 42.2x and 36.8x, with clear increases for Applied Materials, Tokyo Electron, and ASML as well. So investors face two tough questions: How much effective AI data center power will be added, and can the corresponding chip demand drive profit growth fast enough to justify those valuations?
Demand side has not weakened in sync.In the US, operational data center capacity reached 50.7GW at the end of June 2026, up 11.4GW or 29% YoY; planned pipeline capacity hit about 338GW, up 216.6GW or 179%. But the 338GW is just the planning pool and doesn’t equal operational capacity backed by power, financing, land, grid connection, and customer orders. Bernstein’s value is not treating the entire pipeline as sales, but asking: If annual builds really increase 50GW, 75GW, or 100GW by 2030, how much wafer capacity does the semiconductor side need to prep?
The $250 billion figure previously used as the WFE supercycle ceiling.Bernstein’s new framework breaks this into intermediate variables: start with actual GW, then wafer monthly capacity, followed by equipment orders and profits.
From 1GW to 46,000 wafers monthly—how does the model work?
The first step is to translate 1GW into racks and chips.Bernstein uses the Vera Rubin rack as an approximation of 2030 compute architecture: each rack power is about 220kW, so 1GW = about 4,545 racks; each rack uses about 64.6 300mm wafers (across advanced logic, HBM, standard DRAM, and NAND). Racks alone mean 1GW equates to about 294,000 wafers’ one-time demand.
But that’s not all.AI systems need not just rack-level GPU, head-node CPU, and HBM, but also external CPUs for intelligent task orchestration, tool calls, data access, and system services. Bernstein estimates around 95.2 million CPUs in the 70GW 2030 scenario, or 1.36 million CPUs per 1GW; net of rack head-nodes, each 1GW still needs about 9,027 advanced logic wafers. Each external CPU pairs with 0.5TB DRAM, and assuming 80% yield, each 1GW needs about 195,000 DRAM wafers. The model also assumes rack-external data center NAND grows at a 30% CAGR from 2028 to 2030.
The second step is converting annual chip demand to stable monthly capacity.Merging rack-internal and external demand, each 1GW of new annual construction needs about 46,000 pieces/month new capacity: DRAM 24.4k, NAND 9.2k, HBM 7.3k, advanced logic 5.3k. The key overlooked point: by wafer count, memory totals 89%, advanced logic only 11%.
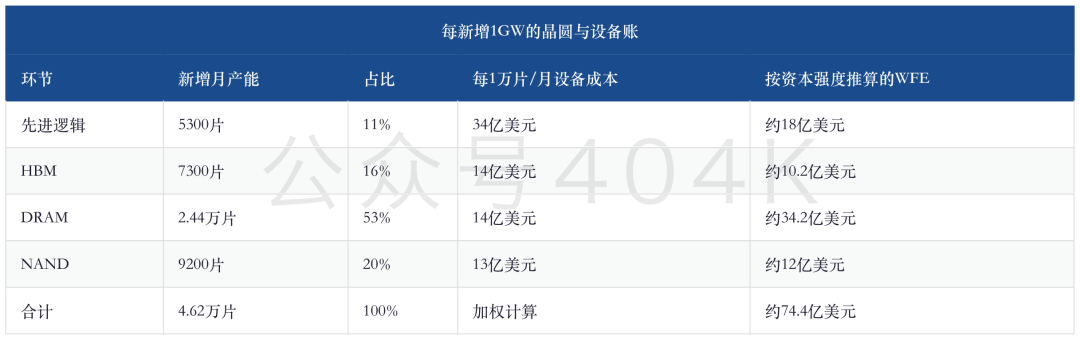
The third step is converting monthly capacity to equipment capital expenditures.Bernstein estimates that each 10,000 pieces/month of advanced logic capacity needs $3.4 billion of equipment; HBM and DRAM about $1.4 billion; NAND about $1.3 billion. Weighted by the above table, each 1GW corresponds to about $7.44 billion, rounded to $7.5–8 billion in the report. Advanced logic is highest in capital intensity, but memory dominates in wafer volume—thus memory delivers about three-quarters of incremental AI WFE.
This algorithm is more useful than “cloud capital spending up equals equipment up,” as every layer can be falsified by real data.If rack power, chip area, yield, server config, DRAM size, or NAND growth change, final WFE also changes.
It's important to distinguish "wafer consumption" from "wafer monthly capacity."The Vera Rubin rack’s 64.6 wafers is a one-time build demand per rack; 46,000 pieces/month is the ongoing production needed to support 1GW annual new data centers. The former answers “how many wafers to build this batch of servers,” the latter “how much to expand the fab.” Multiplying 294,000 pieces per GW again by racks or monthly capacity would result in double-counting WFE.
The model’s time relationship is also key.Cloud providers set budgets, then data center projects secure power and build, after which fabs expand cleanrooms, order equipment, install, ramp yield, and finally chips enter servers. WFE revenue leads effective compute go-live, but not all project conditions; only GW with power, financing, and committed customers has high odds of creating equipment orders.
50GW is not cumulative build, and $300 billion is not a three-year average
The report’s most easily misunderstood part is the meaning of 50GW.The 2026 baseline assumes about 20GW added per year; “2030’s 50GW scenario” means the 2030 annual increase is 50GW over the baseline, or about 70GW new that year, not 50GW cumulative from 2027 to 2030. If the annual path is 30GW in 2027, 45GW in 2028, 60GW in 2029, the three-year cumulative increase is about 135GW—matching the report range of 130–140GW.
Semiconductor equipment must ramp ahead of data center operations.To support 70GW annual additions in 2030, fab capacity must be largely completed by the end of 2029, so equipment orders are concentrated 2027–2029. The 50GW scenario’s incremental AI wafer demand: advanced logic 264k pieces/month, HBM 365k, DRAM 1.22mil, NAND 458k; for AI incremental WFE totaling $376 billion, HBM/DRAM contribute $228 billion.
Bernstein adds a $120 billion/year non-AI WFE baseline for mature nodes, analog chips, China, and other non–data center demand.This yields a 2027–2029 total of $736 billion WFE, average of about $245 billion, with an annual path of $200 billion, $245 billion, $291 billion. The so-called "$300 billion WFE" means $300 billion is approached in 2029 under the 50GW scenario.
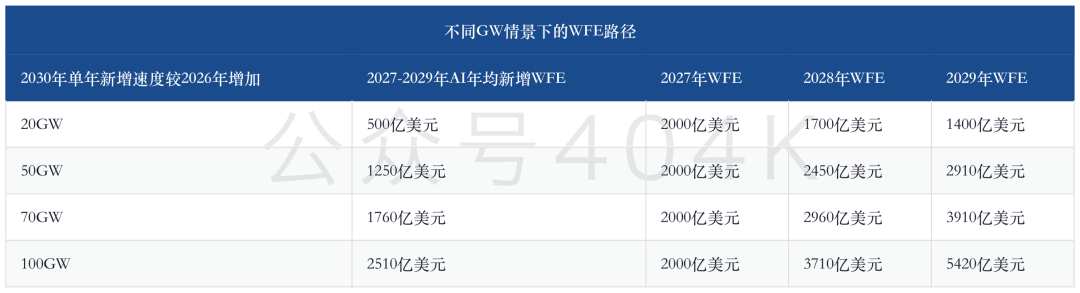
This sensitivity table is not an exact annual forecast.The model fixes 2027 at about $200 billion, then back-solves for 2028/2029 by 2030 goals, so high scenarios are mechanically extrapolated. The 100GW scenario's $542 billion for 2029 is better used to test the supply chain and profit models' upper bounds, not as a baseline target.
Why this wave of equipment demand is led by memory, not advanced logic
The AI equipment discussion often focuses on advanced logic, but Bernstein's model puts the largest increase in DRAM.The reason isn’t just in-rack HBM. The Vera Rubin rack requires logic, HBM, DRAM, and NAND, but the greater swing comes from rack-external CPUs: agents must handle scheduling, retrieval, code execution, tool calls, and state management, much of which happens outside accelerator racks; the assumption of 0.5TB DRAM per CPU pushes standard DRAM wafer demand to over half of the total.
This reshuffles the equipment vendor benefit lineup.Each 10,000 pieces/month advanced logic—$3.4 billion in equipment, highest capex intensity; but DRAM, HBM, and NAND add up to eight times the wafer volume. Looking at total exposure, Applied Materials covers deposition, materials engineering, and storage, so Bernstein rates it as top pick. Lam Research has stronger cycle flexibility for etch, deposition, GAA, and advanced packaging; KLA benefits from raised process complexity/yield needs and more stable process-control margins.
ASML, Tokyo Electron and Japan’s equipment supply chain will also benefit, but the report does not include identical 50/75/100GW profit bridges for them as for the US trio.The WFE ramp does not mean all vendors get the same revenue CAGR. The gain depends on each company’s positioning, customer structure, market share, delivery, and service income.
How to recalculate for Applied Materials, Lam Research, and KLA in 50, 75, and 100GW scenarios
Bernstein further maps industry WFE to equipment income, service income, EPS, and PE, which is closest to investment decisions.In the 50GW scenario, 2029 income is 52.3% above consensus for Applied Materials and Lam Research, 33.1% for KLA; EPS is revised up by 59.5%, 54.4%, and 37.1% respectively. If prices stay flat, 2029 PEs fall to 14.9x, 18.4x, 21.2x.
The 75GW scenario amplifies operating leverage.2029 EPS upgrades would be 120.3% for Applied Materials, 103.8% Lam, 89.5% KLA; PEs 10.8x, 13.9x, 15.3x. The 100GW scenario revisions: 181.0%, 153.3%, 142.0% increases, with PEs of 8.5x, 11.2x, and 12.0x.
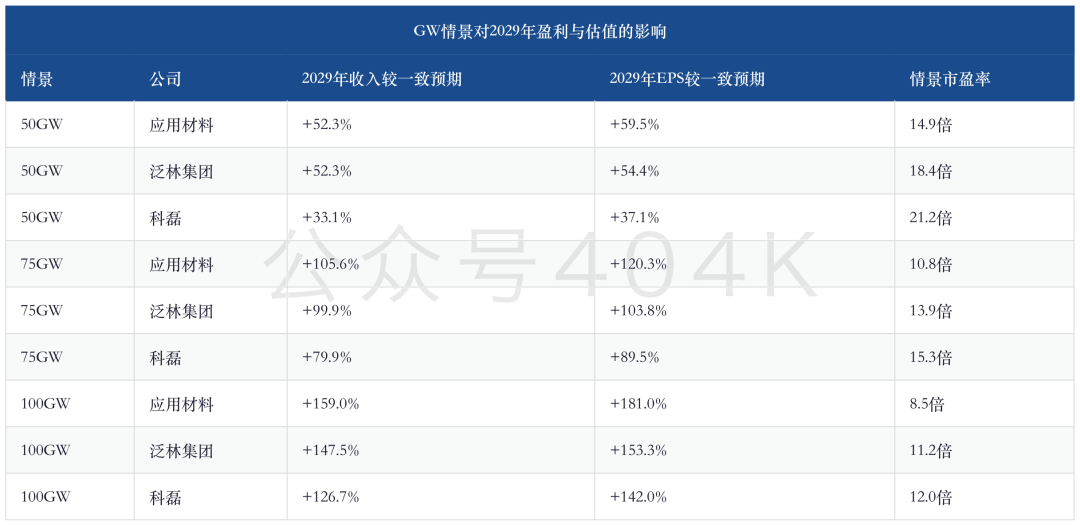
Table data also refines headline summaries.At 75GW not all three EPS double—KLA is 89.5%; nor are all below 10x PE at 100GW, as Lam/KLA are 11–12x. The low scenario PEs result from holding prices constant as profits rise far out—showing earning elasticity, not today’s no-risk value discount.
Applied Materials’ advantage is memory exposure/relative value, Lam Research for etch–deposition and memory elasticity, KLA for process control, margins, and capital return strength.A portfolio should separate gross elasticity and quality of profits: Applied Materials fits the core scenario, Lam is more sensitive to storage expansion slope, KLA needs higher process control to merit its quality premium.
From industry WFE to company EPS, three gates remain.The first is the serviceable market—allocation of $10 billion WFE differs across advanced logic, DRAM, NAND, process control. The second is revenue recognition—equipment faces lags from order to shipped to installed, and service income accumulates with the installed base. The third is incremental margins—rush orders, parts, R&D expense, and bargaining all affect how much extra income is kept. Bernstein’s scenarios add share, service, and margin assumptions, but those are harder to observe than the GW itself.
This also explains differences for the three companies in the same scenario.At 50GW, Applied Materials and Lam have the same 2029 revenue increment, but EPS are upgraded by 59.5% and 54.4% respectively; KLA gains less revenue, but high gross margins, service, and capital efficiency make it a quality asset. If WFE rises but company share or margins do not, industry judgment is right but stock-level profits may diverge from the model.
The remaining 30% of chapters can be viewed by joining Knowledge Planet. The full report and reference documents have been posted there—welcome to join.
Disclaimer: The content of this article solely reflects the author's opinion and does not represent the platform in any capacity. This article is not intended to serve as a reference for making investment decisions.
You may also like
Watch Out: Massive Token Unlocks Are Coming for 17 Altcoins This Week—Here’s the Day-by-Day, Hour-by-Hour List
Bitcoin price rebound faces $64,000 test as RSI divergence signals waning sell pressure
Institutional XRP Exposure Gains Ground

Crypto Investment Fundamentals Split Market: Tokens Fall 36% as Stocks Jump 23%
Crypto prices
More


