
A chart of commodity support and resistance: Gold, Silver, Oil, Gas + Platinum, Palladium, Copper, Agricultural Futures (July 20, 2026)

Huitong Finance July 20th—— A glance at commodity support and resistance: Gold, Silver, Oil, Gas + Platinum, Palladium, Copper + Agricultural Futures. Updated on Monday, July 20, 2026 at 07:20 (UTC+8), specifically covering 14 varieties including Gold, Silver, Platinum, Palladium, Copper + Crude Oil, Natural Gas, Fuel Oil + Wheat, Corn, Cotton. For more details, please refer to the special chart created by Huitong Finance Analyst.
A glance at commodity support and resistance: Gold, Silver, Oil, Gas + Platinum, Palladium, Copper + Agricultural Futures. Updated on Monday, July 20, 2026 at 07:20 (UTC+8), specifically covering 14 varieties including Gold, Silver, Platinum, Palladium, Copper + Crude Oil, Natural Gas, Fuel Oil + Wheat, Corn, Cotton. For more details, please refer to the special chart created by Huitong Finance Analyst.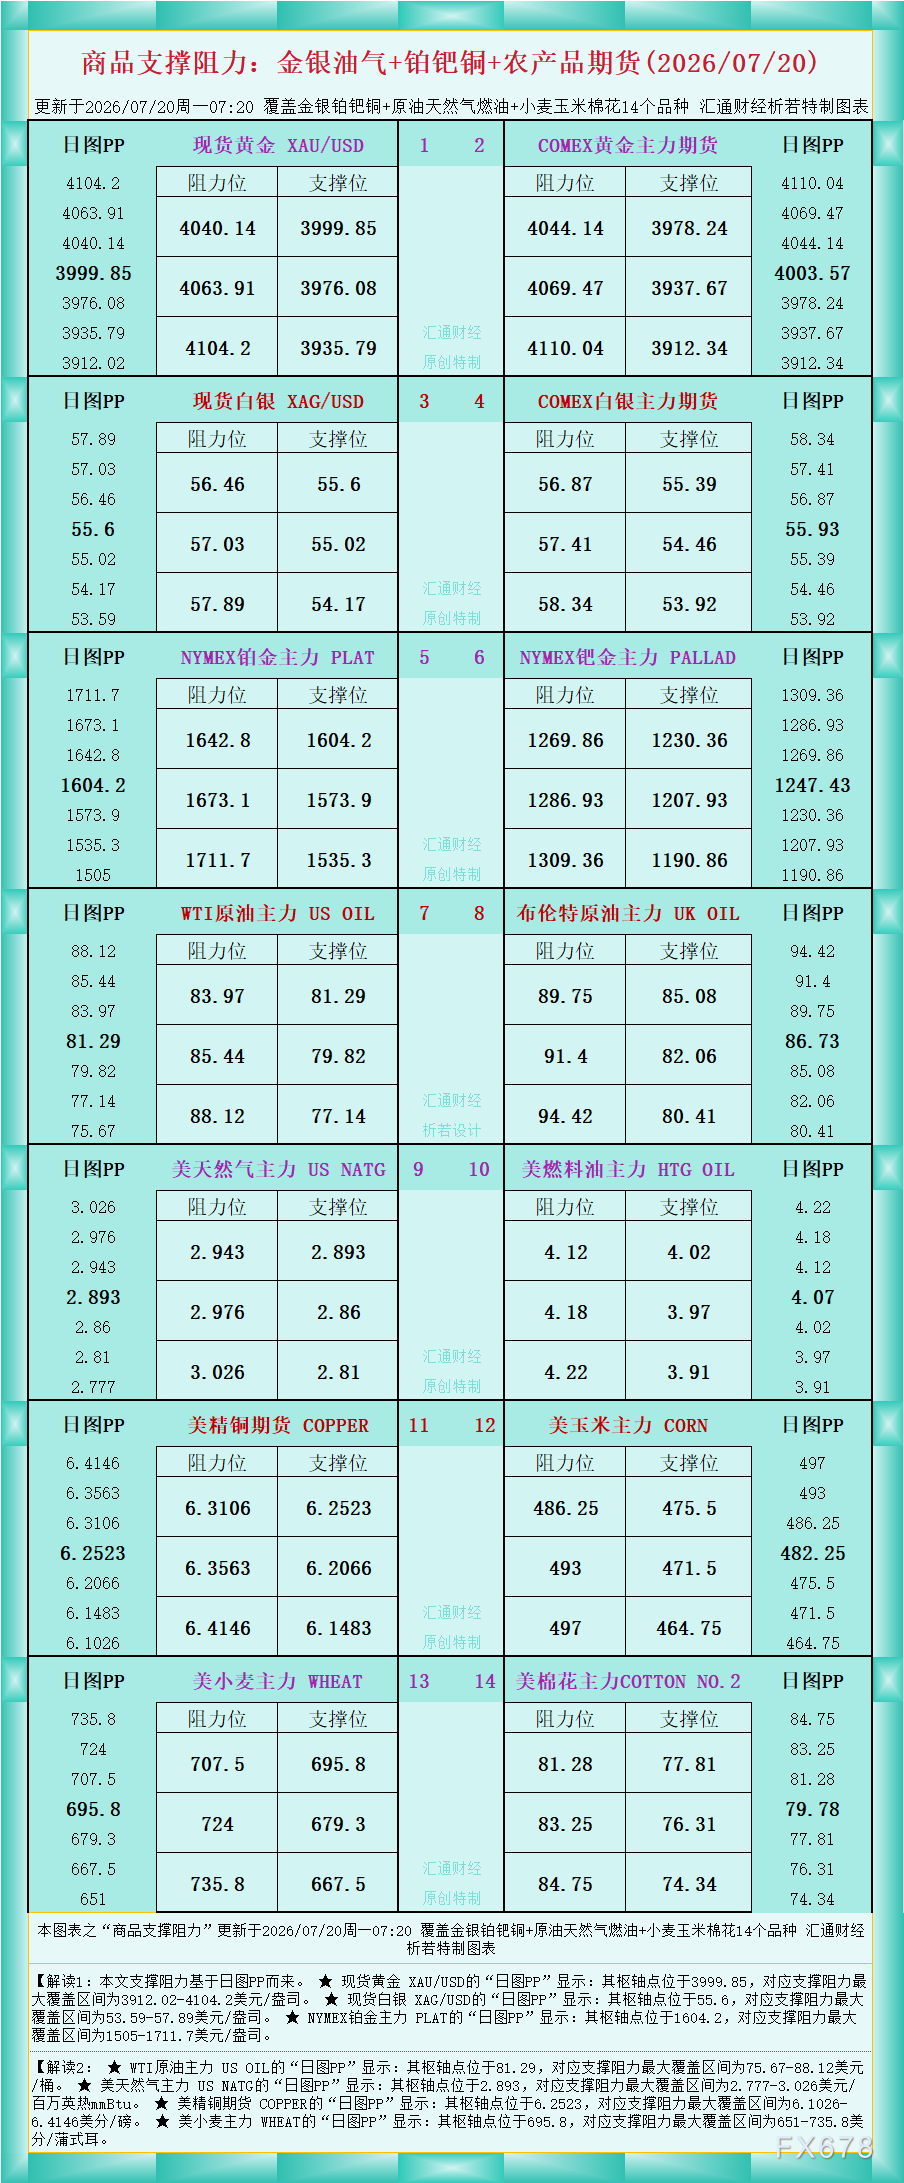
According to the data shown in the chart, Interpretation 1: The support and resistance in this article are based on daily chart PP.
★ The daily chart PP for Spot Gold XAU/USD shows: its pivot point is at 3999.85, with the main support and resistance range covering $3912.02-4104.2/oz.
★ The daily chart PP for Spot Silver XAG/USD shows: its pivot point is at 55.6, with the main support and resistance range covering $53.59-57.89/oz.
★ The daily chart PP for NYMEX Platinum Main Contract PLAT shows: its pivot point is at 1604.2, with the main support and resistance range covering $1505-1711.7/oz.
Interpretation 2:
★ The daily chart PP for WTI Crude Oil Main Contract US OIL shows: its pivot point is at 81.29, with the main support and resistance range covering $75.67-88.12/barrel.
★ The daily chart PP for US Natural Gas Main Contract US NATG shows: its pivot point is at 2.893, with the main support and resistance range covering $2.777-3.026/million BTU.
★ The daily chart PP for US Copper Futures COPPER shows: its pivot point is at 6.2523, with the main support and resistance range covering 6.1026-6.4146 cents/pound.
★ The daily chart PP for US Wheat Main Contract WHEAT shows: its pivot point is at 695.8, with the main support and resistance range covering 651-735.8 cents/bushel.
For more interpretations of varieties, please refer to the chart. Original creation by Huitong Finance, all rights reserved, for reference only.
Disclaimer: The content of this article solely reflects the author's opinion and does not represent the platform in any capacity. This article is not intended to serve as a reference for making investment decisions.
You may also like
Robinhood Chain sees nasty retrace with only 5 tokens above $10M market cap
XRP holds key trendline as SBI Shinsei Bank launches retail rewards program
Tether Gold leads market cap growth in tokenized gold assets, adding $237M
Aave becomes the dominant DeFi venue for tokenized gold deposits
Crypto prices
More


