- HYPE is trading at $59.24, down 10.93% over 7 days and 17.03% over 30 days, as continued whale selling weighs on price.
- An a16z-linked whale has sold another 421,796 HYPE (~$25.3M), bringing total two-day sales to over 858,000 HYPE (~$53.7M).
- HYPE remains below its $67.07 triangle breakdown level, with $58.50 as immediate support and the 100 MA at $55.62 as the next key downside level.
- A move above $72.99 would invalidate the bearish setup, while losing $58.50 could open the door to $55.62 and potentially $43.47.
Hyperliquid’s native token $HYPE has been one of the stronger performers in the broader crypto market throughout 2026, but it has entered a corrective phase in recent weeks. As of July 18, 2026, HYPE trades at $59.24, showing a modest +0.36% gain in the last 24 hours. However, it remains down 10.93% over the past 7 days and 17.03% over the past 30 days, with a market capitalization of approximately $14.998 billion.
 Hyperliquid (HYPE) Price on 18 July 2026/Source: Coinmarketcap
The primary driver remains the same one we identified in our Why HYPE Drops Today article: the a16z-linked whale that began distributing its HYPE position earlier this week has not slowed down.
Yesterday’s $28.38M distribution has been followed by another $25.3M sale in the past 24 hours — bringing the total known distribution from this single wallet to over $53.68M in approximately two days.
The a16z-Linked Whale — Cumulative Distribution Now Exceeds $53M
Lookonchain has confirmed the continued selling activity:
| Prior 2-day distribution | 437,000 HYPE | ~$28.38M |
| Last 24 hours | 421,796 HYPE | ~$25.3M |
| Total known distribution | ~858,796 HYPE | ~$53.68M |
The exchanges receiving these deposits remain consistent — Hyperliquid, OKX, Bybit, and Gate.io — suggesting a deliberate strategy of spreading the distribution across multiple venues to minimise the market impact on any single order book while maintaining a consistent pace of selling.
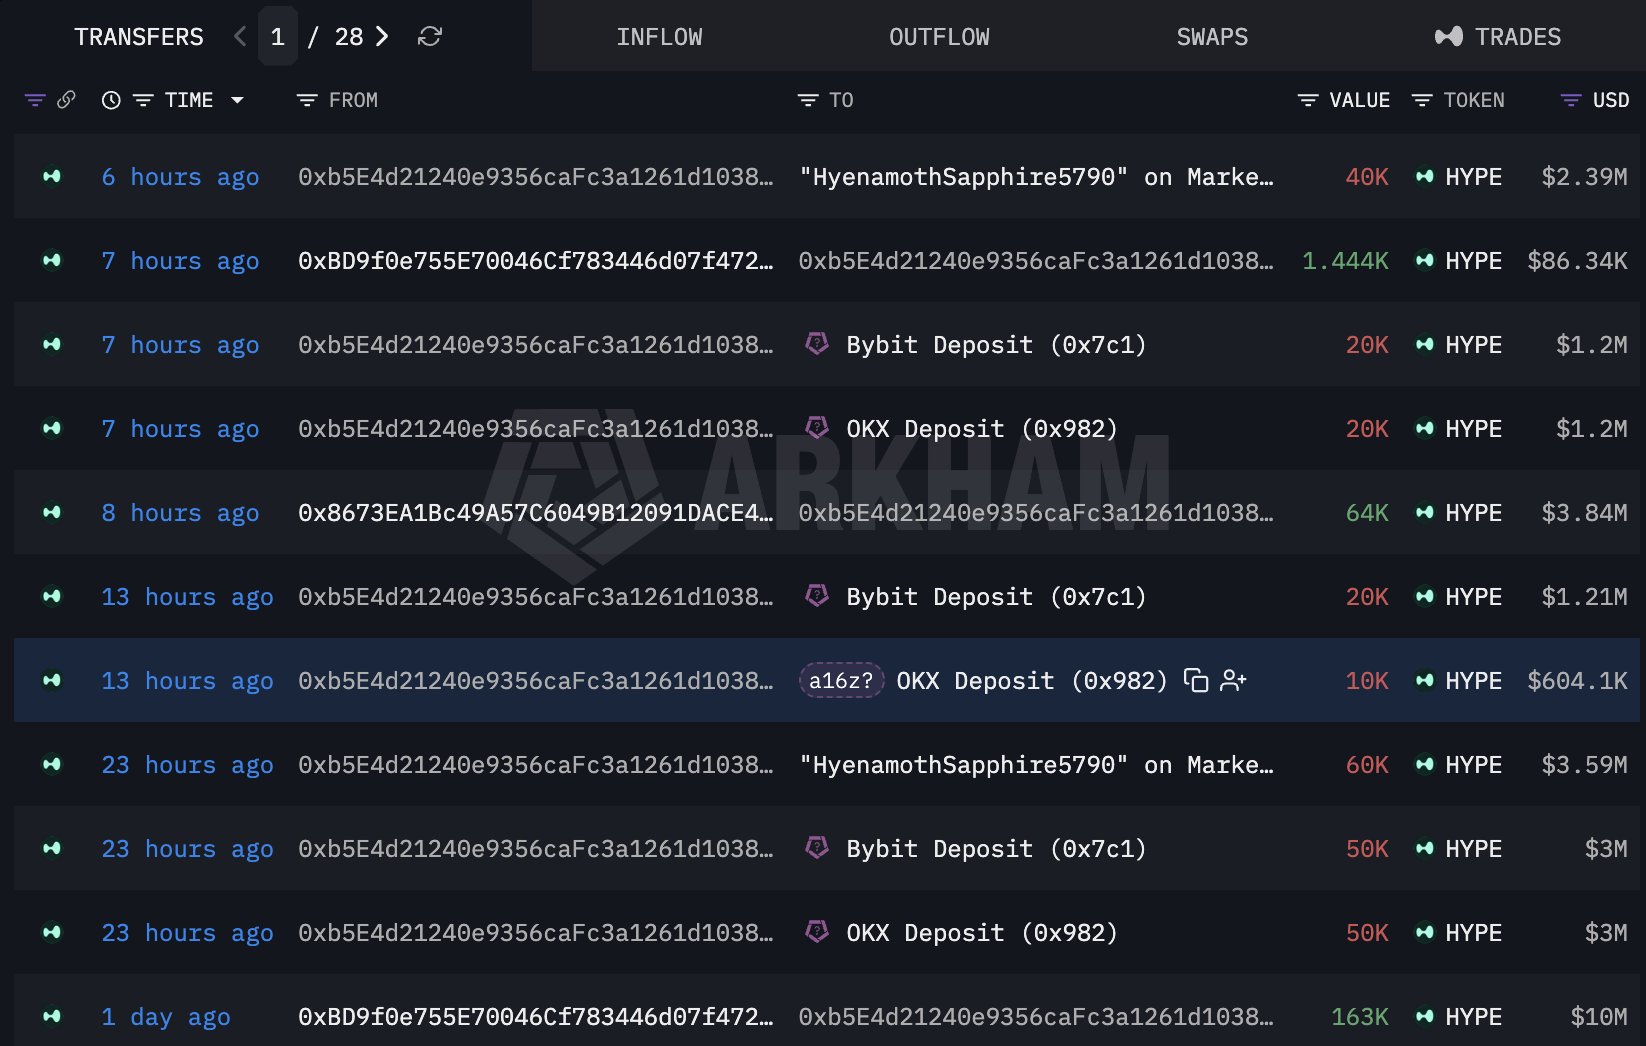 #a16z-linked whale continues selling $HYPE/Source: /Source: @lookonchain (X)
Why the sustained pace matters:
A single large sell event — even at $28.38M — can be absorbed by a market over time as buyers step in at lower prices. A second consecutive day of comparable scale selling ($25.3M) signals that this is not a one-time position reduction but a sustained, deliberate distribution campaign. Markets interpret continued selling from a well-known institutional-linked wallet differently from a one-off event: it signals that the seller is not responding to short-term price movements but executing to a plan.
For HYPE’s price action, the implication is that the supply overhang from this specific wallet will continue to cap recovery attempts until the distribution is complete — the market cannot easily price in how much remains to be sold, which itself becomes a reason for caution among potential buyers.
Technical Analysis — Where HYPE Stands After the Breakdown
As we covered in detail in our Why HYPE Drops article — HYPE confirmed a symmetrical triangle breakdown below the $67.066 level earlier this week. The update as of July 18 shows the pattern has continued to develop as expected:
Breakdown retest confirmed as resistance:
Following the initial breakdown below $67.066, price attempted a retest of the broken trendline — the standard technical behaviour where former support is tested as new resistance. That retest has now conclusively held as resistance, confirming the breakdown is genuine rather than a false move. This is the most important technical update since the original breakdown — it removes the possibility of a quick recovery back above the breakdown level without a significant shift in market dynamics.
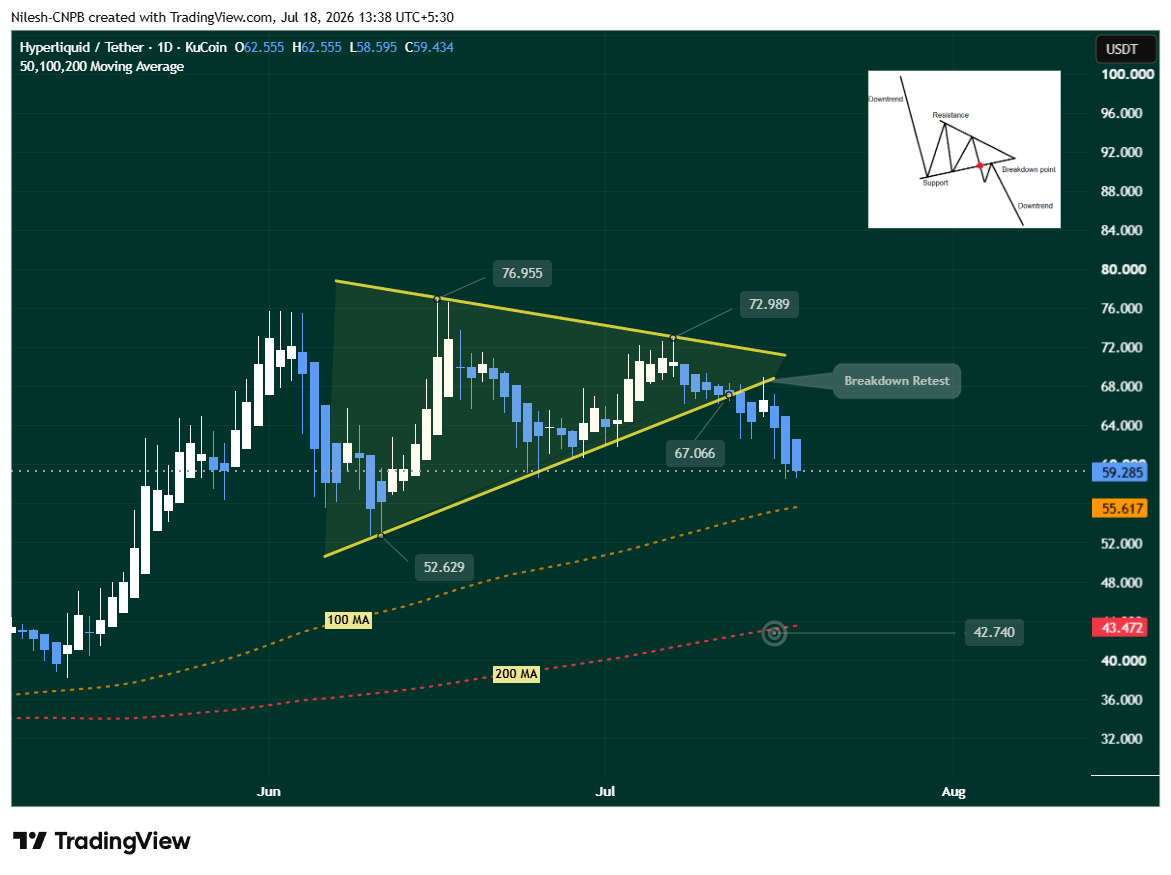 Hyperliquid (HYPE) Daily Chart 18 July 2026 -Coinsprobe/Source: Tradingview
Current price position:
HYPE is hovering just above the $58.50 immediate support area following the retest — a level that has provided near-term stability but has not yet been decisively defended with buying conviction.
The moving average structure:
| 100-day MA | $55.617 | Next critical support below $58.50 |
| 200-day MA | $43.74 | Measured move target / deeper support |
HYPE remains above the 100 MA at $55.617 — an important distinction that keeps the technical picture from being entirely bearish. The 100 MA has historically provided meaningful support during corrective phases, and its defence would be a positive signal that the current correction is not developing into a more significant structural decline.
Bullish Scenario — Reclaim of $72.99
A sustained daily close above $72.99 would invalidate the symmetrical triangle breakdown structure entirely — suggesting the correction has fully absorbed the whale distribution selling and new buying demand is driving a genuine recovery. This scenario would open the path back toward previous highs and potentially new all-time highs if the broader market environment cooperates.
For this scenario to become realistic in the near term, the a16z-linked whale distribution would need to slow or complete, and a new demand catalyst would likely be needed to generate sufficient buying interest to push through the confirmed $67.066 resistance and the $72.99 invalidation level above it.
Bearish Scenario — Loss of $58.50 and $55.617
If HYPE fails to hold the $58.50 immediate support — particularly with continued whale selling adding consistent supply pressure — the next test becomes the 100 MA at $55.617. A loss of the 100 MA on a sustained closing basis would represent a meaningful technical deterioration and increase the probability of the measured move completing toward the 200 MA at $42.74.
From the current price of $59.24, reaching the $42.74 target would represent approximately -28% additional downside — a move that would bring HYPE’s total correction from its recent highs to a scale comparable to the corrective phases seen in other 2026 outperformers during their mid-cycle pullbacks.
Context — What Has Not Changed
It is worth maintaining perspective on what the current correction does and does not represent. HYPE remains +132.49% year-to-date — one of the strongest performances among large-cap crypto assets in 2026. The protocol’s fundamental metrics — trading volume, open interest, fee revenue, and the AQAv2 USDC yield mechanism — have not deteriorated as a result of the whale selling or the technical breakdown.
What has changed is the near-term supply-demand balance: a large, institutional-linked holder is selling a substantial position, creating persistent sell-side pressure that the current level of buying demand has not been sufficient to fully absorb. This is a temporary supply event rather than a fundamental shift — but temporary supply events can produce significant price corrections, particularly when they coincide with a technically confirmed breakdown as they have here.
Bottom Line
HYPE’s corrective phase is continuing into its second week — with the a16z-linked whale’s distribution now totalling over $53.68M across approximately two days of selling, the symmetrical triangle breakdown retest confirmed as resistance, and the token hovering just above the $58.50 immediate support that separates the current zone from the 100 MA at $55.617.
The two variables that will determine direction from here: whether the whale distribution slows or completes — removing the primary supply overhang — and whether $58.50 holds with genuine buying conviction or gives way to a test of the 100 MA below. Until the distribution pace changes, the path of least resistance remains toward the downside targets unless a new demand catalyst emerges.
Frequently Asked Questions (FAQ)
Who exactly is the a16z-linked whale?
The term “a16z-linked whale” refers to one or more wallets that on-chain analysts (primarily Lookonchain and Arkham Intelligence) have associated with Andreessen Horowitz (a16z) — the prominent Silicon Valley venture capital firm with a major crypto investment arm (a16z Crypto).