
GBP/USD Price Forecast: Soft US CPI data backs upside towards 1.3500

The British Pound (GBP) is up 0.1% at around 1.3403 against the US Dollar (USD) during the European trading session on Wednesday. The GBP/USD pair gains as the US Dollar comes under selling pressure, with market participants dialing down expectations for Federal Reserve (Fed) interest rate hikes.
In the European trade, the US Dollar Index (DXY), which tracks the Greenback’s value against six major currencies, has recovered its early losses and is marginally down to near 100.87. However, the DXY is still holding Tuesday’s losses.
According to the CME FedWatch tool, the odds of the Fed raising interest rates in the policy meeting this month have eased to 16.6% from 41.7% recorded on Monday.
Traders pare hawkish Fed bets as the United States (US) Consumer Price Index (CPI) report for June showed on Tuesday that both headline and core inflation grew at a slower-than-expected pace.
In the United Kingdom (UK), Andy Burnham is set to replace Prime Minister (PM) Keir Starmer on July 20 and will likely appoint a new Finance Minister (FM). The smooth UK leadership transition is supporting the British Pound.
GBP/USD technical analysis
GBP/USD trades slightly higher at around 1.3400, holding a mildly bullish near‑term bias as it remains above the 20‑period exponential moving average (EMA) at 1.3350. However, the overall trend appears sideways amid the Descending Triangle formation.
The Relative Strength Index (RSI) at 55.93 suggests steady, but not overextended, upside momentum.
On the downside, initial support is seen at the current price area around 1.3401, with the 20‑period EMA at 1.3350 reinforcing a nearby demand zone before the structural floor defined by the rising trend‑line break near 1.3166. On the topside, a sustained move above 1.3520, where the descending resistance trend line break level resides, would be needed to open the door for a more decisive bullish extension beyond the recent range. Above 1.3520, the pair could extend its advance towards 1.3600.
Disclaimer: The content of this article solely reflects the author's opinion and does not represent the platform in any capacity. This article is not intended to serve as a reference for making investment decisions.
You may also like
What is the actual oil flow through the Strait of Hormuz? US Department of Energy data differs from market tracking data by a factor of two
The U.S. Secretary of Energy stated that the daily oil flow through the Strait of Hormuz reaches 9 million barrels, while data from third-party vessel tracking agencies such as Kpler show only about 4 million barrels, nearly a twofold difference. The core of the dispute lies in the fact that many tankers turn off their transponders to avoid attacks, creating "shadow transits" and resulting in data blind spots. If tracking data becomes more accurate, the risk of shortages faced by the oil market could far exceed expectations.
MSCI revisits index exclusion for Strategy and Metaplanet

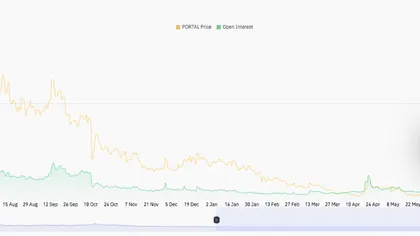
Portal Price Prediction: PORTAL Holds Bullish Structure as Profit-Taking Risk Rises
The more you earn, the more you lose! Amid the AI computing frenzy, how big is the "debt bomb" lurking behind CoreWeave (CRWV.US)?
CoreWeave (CRWV.US) investors are rejoicing over the explosive growth in computing power demand, but they are overlooking potential "landmines" on the company’s balance sheet that could threaten its survival.

Crypto prices
More


