

Solana is maintaining its short-term support between $74 and $77, leaving open the possibility of another move toward the $87 and $100 resistance levels. Despite the current consolidation, analysts note that the broader chart pattern leaves space for a deeper correction, potentially dipping into the $30 to $52 accumulation area before a more significant recovery takes hold.
Solana holds $74 support, eyes $87 resistance as bulls defend recovery zone
By:Cointurk
Bitget offers one-stop trading for cryptocurrencies, stocks, and gold. Trade now!
A welcome pack worth 6200 USDT for new users! Sign up now!
Support Holds as Buyers Absorb Pressure
SOL is currently consolidating after a recent rebound, indicating a period of stabilization. The daily chart suggests that buyers are actively absorbing selling pressure, allowing the broader recovery structure to remain in place. Such controlled declines have so far prevented a rapid loss of momentum among bullish traders.
At present, Solana is holding above a clear rising trendline, with price action clustered around the $77 mark. The coin continues to hover near a supportive cloud zone stretching from $74 to $77, making this range crucial for determining the next directional move in the market.
A decisive rebound from current levels could push SOL toward the major resistance at $87.20. If the price can break and sustain a position above this barrier, the next targets include $96, followed by the psychologically important $100 to $104 zone.
Strength above the $87 region could provide the momentum needed for Solana to challenge higher resistance bands, potentially opening a path toward new highs.
However, the bullish scenario remains vulnerable. If the daily chart loses the rising trendline and SOL drops below $74, this would undermine the positive outlook and increase the risk of a decline toward the upper $60 range.
Correction May Offer Long-Term Accumulation Opportunity
Technical analyst Crypto Patel pointed to the possibility of a deeper correction, referencing a three-week Solana chart formation. This setup highlights a major long-term accumulation zone between approximately $30 and $52, where longer-term investors might see an opportunity for strategic entries.
Following its drop from the $240 resistance zone, SOL now trades near $77, still well below significant barriers at $95 to $100 and $140. As a result, the wider trend has yet to turn convincingly bullish.
Crypto Patel identified a green fair value gap as a potential low-risk accumulation area. If SOL retraces into this region, it could complete the correction phase and provide patient buyers with a more compelling entry point. However, the path to recovery requires Solana to stabilize and construct a durable support base within this zone.
A recovery sequence would likely begin with a reclamation of the $95 to $100 range. Overcoming this hurdle could improve market sentiment and open the door to a further rally toward $140.
A continued move above $240 would mark a powerful shift toward a long-term bullish reversal. Nevertheless, this prospective trajectory remains uncertain, as SOL might start to recover earlier, or drop below the $30 threshold, compromising the broader bullish framework.
Mini dictionary: Crypto Patel is an independent cryptocurrency chart analyst who shares technical insights and trading ideas on platforms including X, focusing on medium- and long-term price structures for various digital assets.
Key SOL Levels Support/Resistance Implication
| $30 – $52 | Support (Accumulation) | Potential entry for long-term buyers |
| $74 – $77 | Support | Short-term direction depends on this zone |
| $87 | Resistance | Break could signal upside momentum |
| $95 – $100 | Resistance | Recovery acceleration zone |
| $140 | Resistance | Confirmation of broader trend change |
| $240 | Major resistance | Break shows long-term bullish reversal |
Analysts consider the area between $30 and $52 as an important accumulation zone for SOL, where downside risk may provide patient investors with a favorable entry point if current support levels break down.
0
0
Disclaimer: The content of this article solely reflects the author's opinion and does not represent the platform in any capacity. This article is not intended to serve as a reference for making investment decisions.
Understand the market, then trade.
Bitget offers one-stop trading for cryptocurrencies, stocks, and gold.
Trade now!
You may also like
Deutsche Bank: Central bank gold purchases and ETF inflows put gold in an "explosive" rally phase
Deutsche Bank believes that the fifth "explosive" upward phase in gold, which began in 2024, is still ongoing. Central bank gold demand, measured in actual US dollars, has reached a record high, with about half of the demand not reported to the IMF. Global ETF inflows have turned positive again, with Asian buying being particularly notable. The bank has set a year-end target range for gold at $4,700–$5,100 per ounce, with the core driver being the continued expansion of U.S. government debt. Current futures positions remain low, and the upside potential has not yet been fully priced in.
华尔街见闻•2026/08/16 06:01
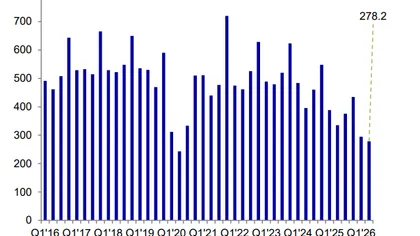
Nvidia (NVDA.US) plans to invest $3 billion to enter SB Energy: from selling chips to securing the OpenAI "electricity-park-computing power" chain
Analysts point out that Nvidia may be able to intervene early in a critical aspect of GPU order fulfillment by investing in the developer of OpenAI’s data centers.
智通财经•2026/08/16 05:06

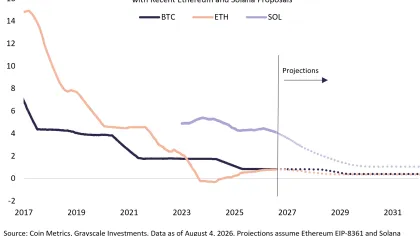
Ethereum and Solana may become scarcer – THESE Grayscale projections say…
AMBCrypto•2026/08/16 05:03
Crypto prices
More
Bitcoin
BTC
$62,993.71
-0.02%

Ethereum
ETH
$1,877.97
-0.04%

Tether USDt
USDT
$0.9991
+0.01%

USDC
USDC
$0.9999
+0.00%

XRP
XRP
$0.9993
-0.39%

Solana
SOL
$75.31
+0.02%

TRON
TRX
$0.3308
-0.46%

Hyperliquid
HYPE
$56.93
+1.44%

Dogecoin
DOGE
$0.06965
-0.63%

Zcash
ZEC
$486.3
-0.95%
How to buy BTC
Bitget lists BTC – Buy or sell BTC quickly on Bitget!
Trade now
Become a trader now?A welcome pack worth 6200 USDT for new users!
Sign up now