
A Chart of Commodity Support and Resistance: Gold, Silver, Oil, Gas + Platinum, Palladium, Copper, Agricultural Futures (June 30, 2026)

FX678 June 30—— A single chart visualizing commodity support and resistance: gold, silver, oil, gas, platinum, palladium, copper, and agricultural futures, updated on Tuesday, June 30, 2026, 07:00 (UTC+8). Specifically covering 14 varieties including gold, silver, platinum, palladium, copper, crude oil, natural gas, fuel oil, wheat, corn, and cotton. For more details, refer to the FX678's custom chart.
A chart visualizing commodity support and resistance: gold, silver, oil, gas, platinum, palladium, copper, and agricultural futures, updated on Tuesday, June 30, 2026, 07:00 (UTC+8). Specifically covering 14 varieties including gold, silver, platinum, palladium, copper, crude oil, natural gas, fuel oil, wheat, corn, and cotton. For more details, see the content in the specially-made FX678 chart.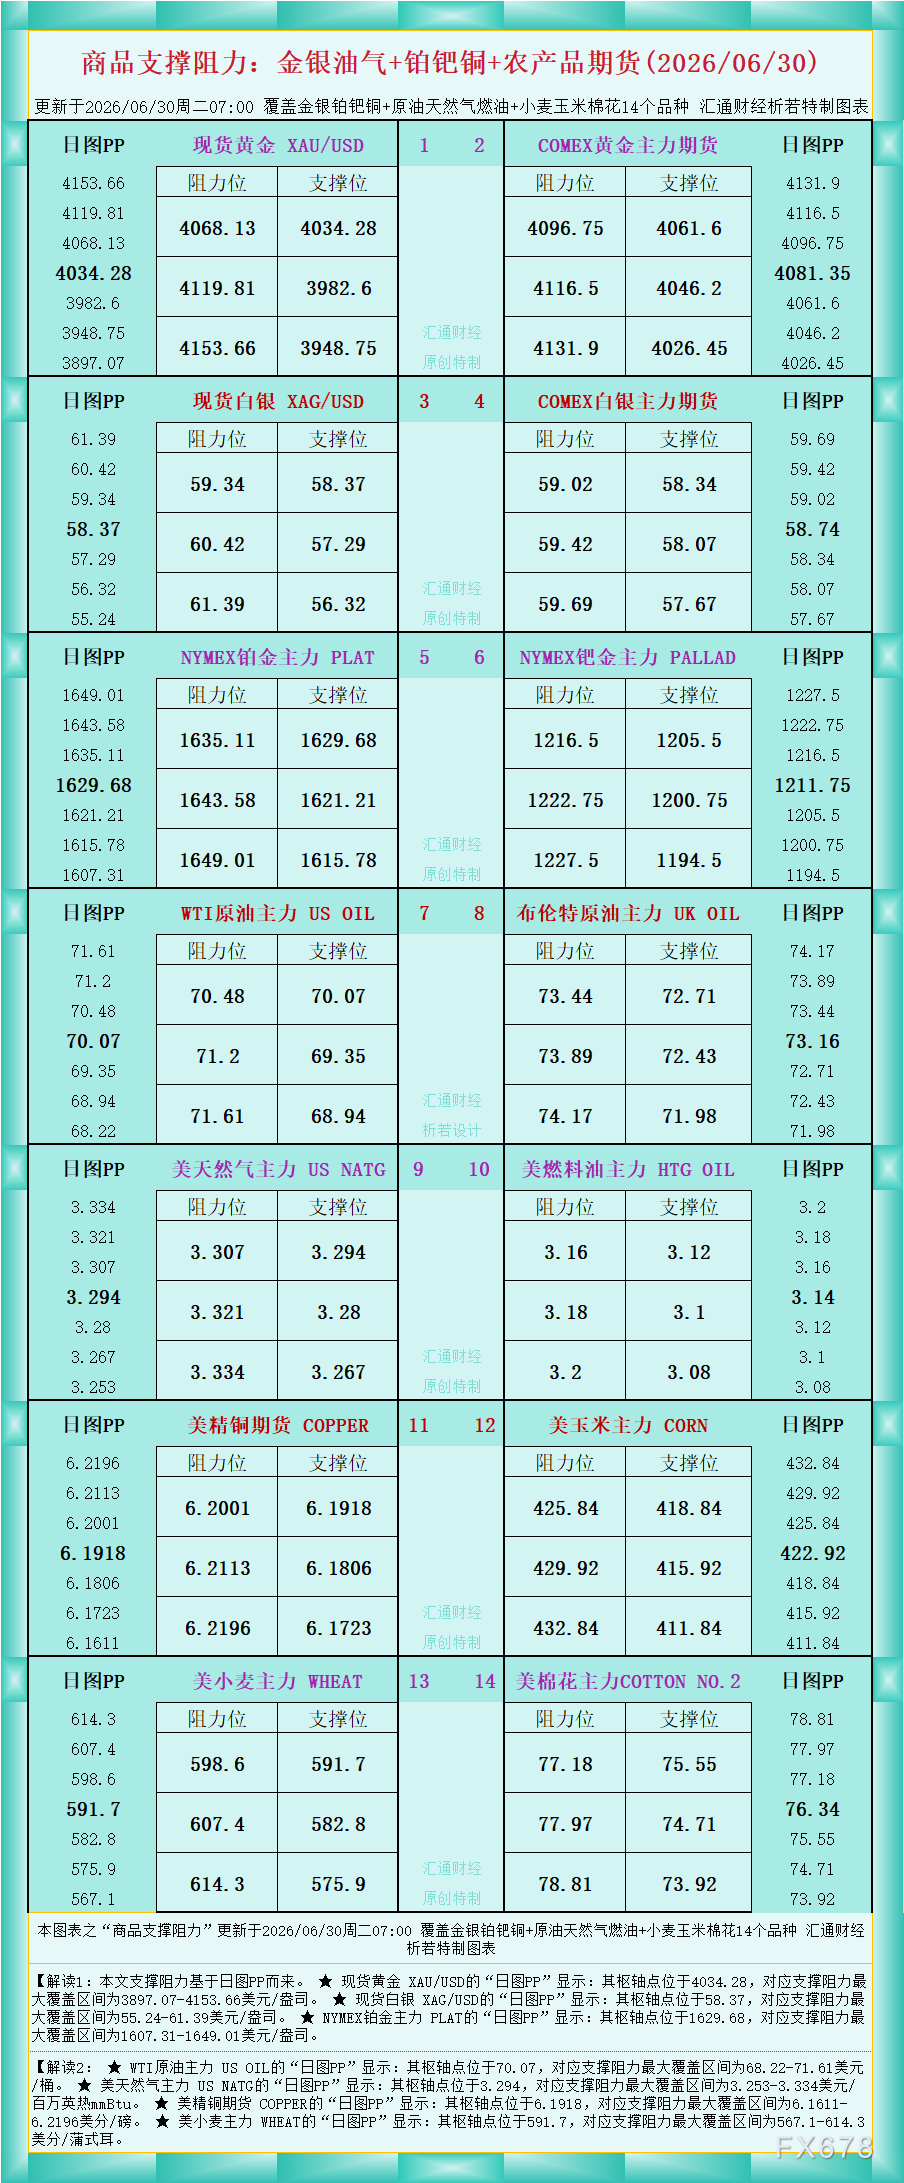
As shown in the figure, Interpretation 1: The support and resistance levels in this article are based on the daily chart pivot points (PP).
★ For spot gold XAU/USD, the “Daily Chart PP” shows: the pivot point is at 4034.28, with the maximum support and resistance range covering $3897.07-$4153.66/oz.
★ For spot silver XAG/USD, the “Daily Chart PP” shows: the pivot point is at 58.37, with the maximum support and resistance range covering $55.24-$61.39/oz.
★ For NYMEX platinum main contract PLAT, the “Daily Chart PP” shows: the pivot point is at 1629.68, with the maximum support and resistance range covering $1607.31-$1649.01/oz.
Interpretation 2:
★ For WTI Crude Oil main contract US OIL, the “Daily Chart PP” shows: the pivot point is at 70.07, with the maximum support and resistance range covering $68.22-$71.61/barrel.
★ For US natural gas main contract US NATG, the “Daily Chart PP” shows: the pivot point is at 3.294, with the maximum support and resistance range covering $3.253-$3.334/MMBtu.
★ For US copper futures COPPER, the “Daily Chart PP” shows: the pivot point is at 6.1918, with the maximum support and resistance range covering 6.1611-6.2196 cents/pound.
★ For US wheat main contract WHEAT, the “Daily Chart PP” shows: the pivot point is at 591.7, with the maximum support and resistance range covering 567.1-614.3 cents/bushel.
For more variety interpretations, refer to the chart. Produced originally and exclusively by FX678. All rights reserved.
Disclaimer: The content of this article solely reflects the author's opinion and does not represent the platform in any capacity. This article is not intended to serve as a reference for making investment decisions.
You may also like
Federal Reserve Beige Book Warns of "Fierce" Oil Prices: Half of Districts Face Strong or Intensifying Price Pressures, Businesses Confront Price Increases and Profit Squeeze
The Beige Book shows that all 12 Federal Reserve districts reported the impact of rising oil prices. Businesses generally indicated that high diesel prices and fuel surcharges are passing additional costs down the entire supply chain. Since the previous Beige Book report just over a month ago, the U.S. economy has experienced moderate growth, with manufacturing serving as the main support. The labor market continues to see low hiring and low layoffs, and firms in nearly half the districts reported that AI investment is impacting employment.
Crypto market wipes out over $42 billion amid sticky U.S. inflation

Shiba Inu Forms First 4-Hour Death Cross Setup in October: Potential Scenarios
Crypto prices
More


