Bitget App
Trade smarter
Buy cryptoMarketsTradeFuturesStocksEarnInstitutionAI & More
Algorand forms 2 bullish patterns, but THIS group must step in

Algorand forms 2 bullish patterns, but THIS group must step in

CryptoNewsNetCryptoNewsNet2026/06/24 21:21
By:CryptoNewsNet
Back to the list

Algorand forms 2 bullish patterns, but THIS group must step in

Algorand forms 2 bullish patterns, but THIS group must step in image 0  ambcrypto.com 17 m
Algorand forms 2 bullish patterns, but THIS group must step in image 1

Algorand [$ALGO] has struggled through the broader market downturn, trading only about 15% above its late-March all-time low. The altcoin is now attempting a recovery, with several technical and on-chain signals suggesting a bullish outlook could emerge if key levels hold.

Can $ALGO maintain its bullish structure?

Algorand’s chart structure continued favoring a potential rebound.

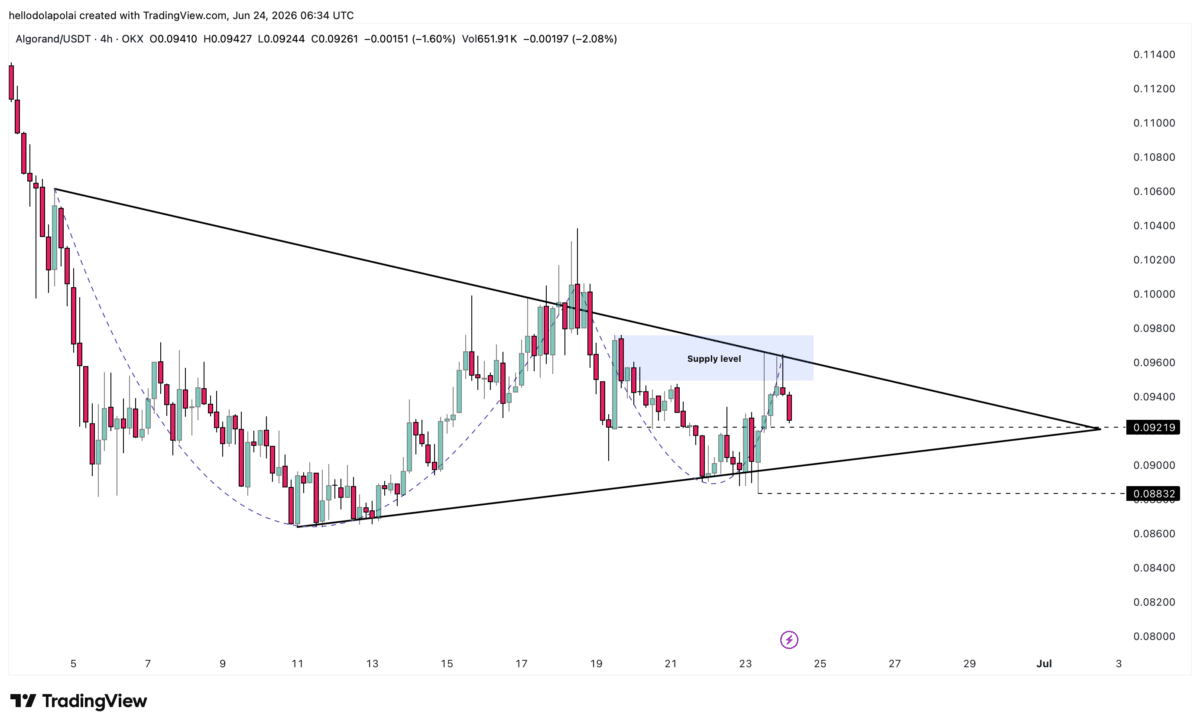
On the higher timeframe, price remained within two bullish formations: a Symmetrical Triangle and a Cup-and-Handle pattern. Both patterns have historically preceded rallies.

However, Algorand [$ALGO] would need to break above the descending resistance line to confirm either setup.
Algorand forms 2 bullish patterns, but THIS group must step in image 2 Source: TradingView

In the short term, $ALGO entered a key supply zone, where sellers stepped in and triggered the latest pullback. The $0.092 level remained a critical support zone.

If buyers defend it, $ALGO could rebound and retest overhead resistance.

However, a rejection there could send the asset back toward the Symmetrical Triangle’s lower support. A drop below $0.088 would invalidate both bullish structures and increase the risk of further downside.

What did the indicators show?

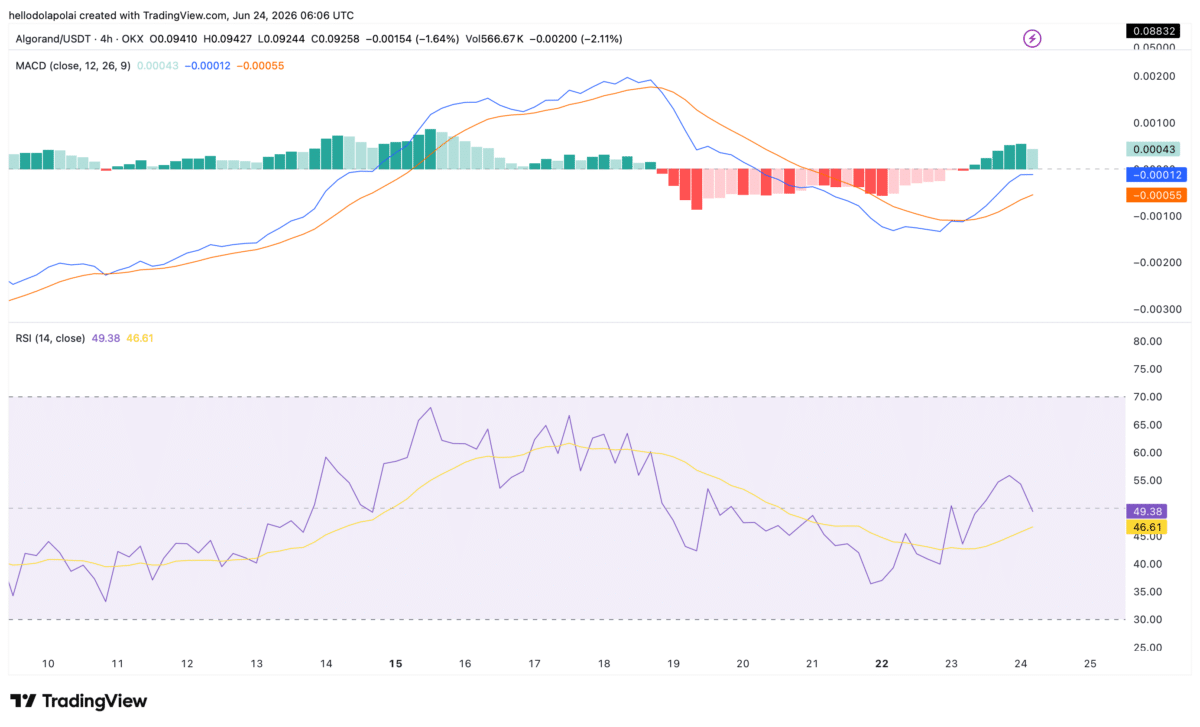
The bearish case had not fully developed, as technical indicators continued signaling underlying strength.

The Moving Average Convergence Divergence (MACD) recently formed a golden cross, with the MACD line moving above the signal line. That crossover often reflects strengthening buying momentum.

On top of that, both lines approached positive territory. A move above zero could reinforce the bullish outlook.
Algorand forms 2 bullish patterns, but THIS group must step in image 3 Source: TradingView

Meanwhile, the Relative Strength Index hovered near the neutral zone. The indicator suggested momentum remained balanced, leaving $ALGO without a clear directional bias.

As a result, the market remained vulnerable to either a recovery attempt or another pullback.

Are Algorand’s whales controlling the trend?

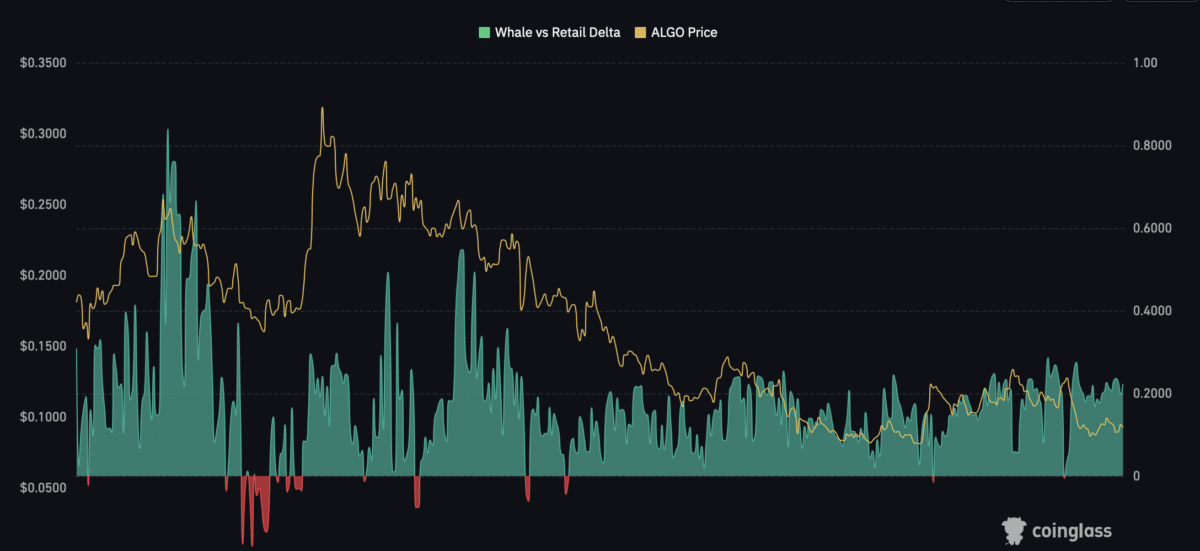
Much of $ALGO’s near-term outlook may depend on whale activity.

Currently, whales dominate the whale-versus-retail delta, indicating larger holders remain the primary drivers of market activity. That dynamic suggested buying pressure could remain limited unless whale participation increased further or retail demand strengthened.
Algorand forms 2 bullish patterns, but THIS group must step in image 4 Source: CoinGlass

By contrast, Spot Netflows pointed to persistent selling pressure.

Over the past 15 days, the market recorded $1.75 million in net outflows following a larger $29.23 million sell-off. Algorand continued showing early signs of recovery. However, whale activity and the defense of key support levels remained critical to sustaining any upside move.

Final Summary

  • $ALGO remained above a critical support zone between $0.092 and $0.088.
  • The MACD formed a golden cross, suggesting buying strength may be returning.
0
0

Disclaimer: The content of this article solely reflects the author's opinion and does not represent the platform in any capacity. This article is not intended to serve as a reference for making investment decisions.

Understand the market, then trade.
Bitget offers one-stop trading for cryptocurrencies, stocks, and gold.
Trade now!

You may also like

US CPI Heats Up Across the Board, Triggering "Inflation Spiral" Alert; October Rate Hike Odds Once Hit 50%. "New Fed News Agency": Watch Waller's Speech This Week

After the CPI was released, the market-implied rate hike probability first rose to 50% before falling back to 40%. Wall Street generally believes that whether action will be taken in October still depends on how the Federal Reserve assesses inflation trends. "The New Fed News Agency" noted that, unlike in August when price increases were concentrated in certain items, the stronger-than-expected performance of September's core CPI was more broad-based, further reinforcing the case for a December rate hike. The speech by Waller on Friday morning Beijing time is his last public statement before the Fed's blackout period ahead of this month's meeting. Economists are warning about an "inflation spiral," with real purchasing power and midterm election pressures interweaving.

华尔街见闻•2026/10/14 23:02

The calm period in the US stock market is over! The S&P 500 ends its record of 53 consecutive trading days without a drop of over 1%. AI stock sell-off intensifies market concerns.

The S&P 500 Index fell by 1.1%, ending a streak of 53 consecutive trading days without a drop of 1% or more. This was the longest period of calm since January 2020.

智通财经•2026/10/14 22:37

Federal Reserve Beige Book: U.S. economy expands moderately but inflationary pressures intensify; AI boosts productivity curbing some corporate hiring demand

The latest Beige Book released by the Federal Reserve on Wednesday shows that overall economic activity in the United States continues to grow, but performance varies across regions. Consumer spending remains generally weak, and there has been little change in the labor market.

智通财经•2026/10/14 22:36

Overnight US Stocks | September Inflation Remains High, Major Indexes Decline, Coreweave (CRWV.US) Drops Over 15%

At the close, the Dow Jones Industrial Average fell by 47.96 points, or 0.09%, to 51,622.14 points; the S&P 500 Index dropped by 85.95 points, or 1.10%, to 7,719.50 points; and the Nasdaq Composite Index declined by 511.51 points, or 1.88%, to 26,692.87 points.

智通财经•2026/10/14 22:36