ambcrypto.com
Bitcoin Cash [$BCH] has been trading within a range for just over two years. Since April 2024, the once-prominent altcoin has been constrained to within the $272-$684 range.
This range is massive in both time and size, giving swing traders many more opportunities to enter the market with conviction than lower timeframe ranges might.
A month ago, AMBCrypto reported that $BCH was likely to continue its downtrend after revisiting the $480-$500 magnetic zone of short liquidations.
This expectation has come to pass. The $460 short-term support zone, once ceded to the sellers, quickly gave way to a 25.16% Bitcoin Cash drop from $465 (bearish retest) to $348.3.
Has the bearish impulse move ended, or should traders expect further losses?
Technical indicators suggest an overextended market
 Source:
$BCH/USDT on TradingView
Source:
$BCH/USDT on TradingView
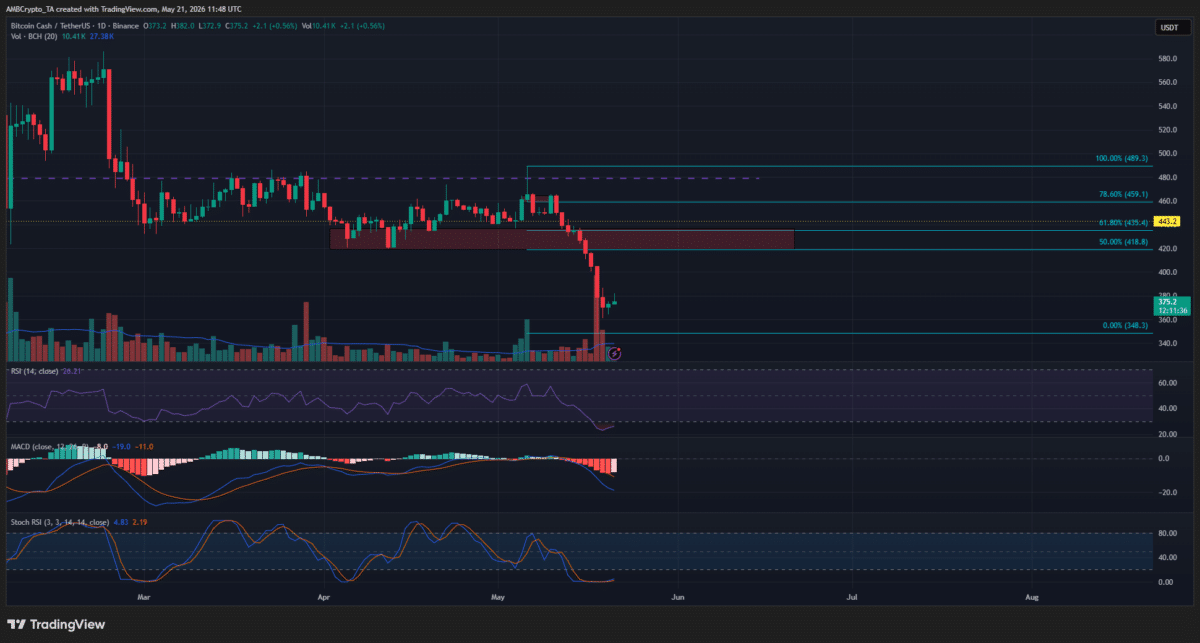
The biggest sign that the impulse move downward might be over was the high-volume slide to $348, followed by a lower-timeframe bounce.
The large downward candlewick on Monday, the 18th of May, told a story of an overextended price move.
The RSI was at 26, within the oversold territory, while the Stochastic RSI appeared to form a bullish crossover. Together, they signaled a potential short-term bounce.
The Fibonacci retracement levels (cyan) were plotted using this impulse bearish move. A bounce to $418 is likely, though it can extend as high as $459 and the $489 swing high.
Therefore, traders can look to utilize a bounce to these levels to look for shorting opportunities. It must be noted that a retest of the key Fibonacci levels is not an automatic sell signal.
An internal structural shift on the lower timeframe price chart, such as the 1-hour, can be used to increase the odds of a successful trade.
It is also possible that $BCH bears will not allow a sizeable bounce. Depending on the wider market sentiment in the coming days, a bounce might struggle to clear the $400 area before falling to make new lows.
Traders should avoid FOMO and have clear rules to follow before entering. Rather than buying the bounce, swing traders might find a more feasible opportunity in selling the bounce.
Final Summary
- The Bitcoin Cash rejection at $465 resulted in a 25% price slide that reached a swing low of $348.
- The current bounce is just a relief rally, and the trend continues to favor the sellers.