
Fed Chair Succession = US Stock Market Plunge?

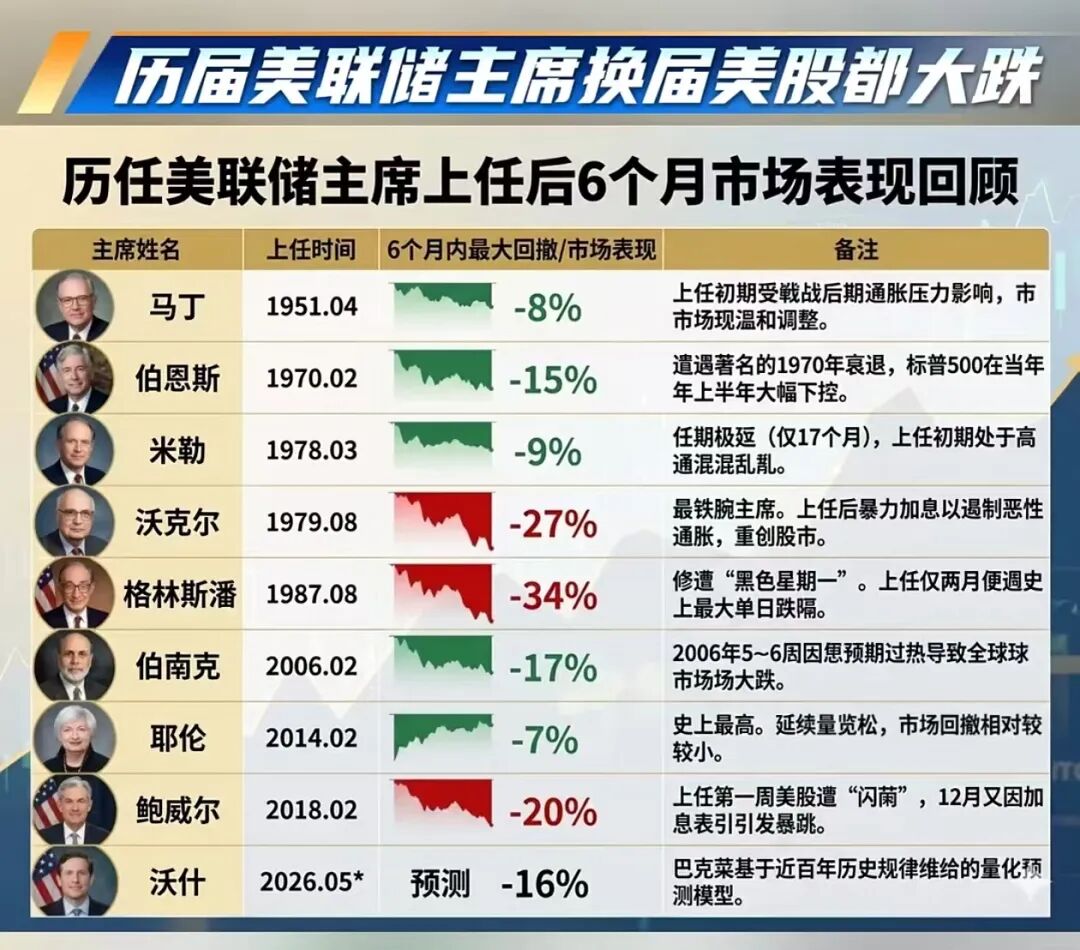
2. Take Powell as an example. He was sworn in on February 5, 2018, whereas the early 2018 flash crash occurred on January 26. Using calculation A, the maximum drawdown within six months of Powell’s appointment was 2.56%. Using calculation B, the max drawdown was 9.45%—both significantly lower than what’s shown in the chart.
3. Furthermore, regardless of which drawdown calculation is used, the maximum drawdown within six months of a Fed chair taking office is not significantly different from the maximum drawdown over any random six-month period in S&P500 history.
4. Using calculation A:
1) The maximum six-month drawdowns after the last seven Fed chair appointments are as follows:
Miller (1978-03-08): 0.00%
Volcker (1979-08-06): 4.25%
Greenspan (1987-08-11): 32.82%
Bernanke (2006-02-01): 4.58%
Yellen (2014-02-03): 0.00%
Powell (2018-02-05): 2.56%
2) Distribution of maximum S&P500 drawdowns over any six-month period in history:
10th percentile: 0.09%
25th percentile: 1.44%
75th percentile: 8.98%
90th percentile: 16.24%
The medians are nearly identical. Statistical tests for equality of means: t-test p=0.2870, Wilcoxon test p=0.3438; there is no significant difference.
5. Using calculation B
1) The maximum drawdowns for the last seven chairs within six months of taking office:
Burns (1970-02-01): 23.21%
Miller (1978-03-08): 17.12%
Volcker (1979-08-06): 13.31%
Greenspan (1987-08-11): 33.51%
Bernanke (2006-02-01): 7.70%
Yellen (2014-02-03): 12.38%
Powell (2018-02-05): 9.45%
2) Distribution of maximum S&P500 drawdowns over any six-month period in history:
10th percentile: 7.80%
25th percentile: 9.97%
75th percentile: 17.74%
90th percentile: 22.12%
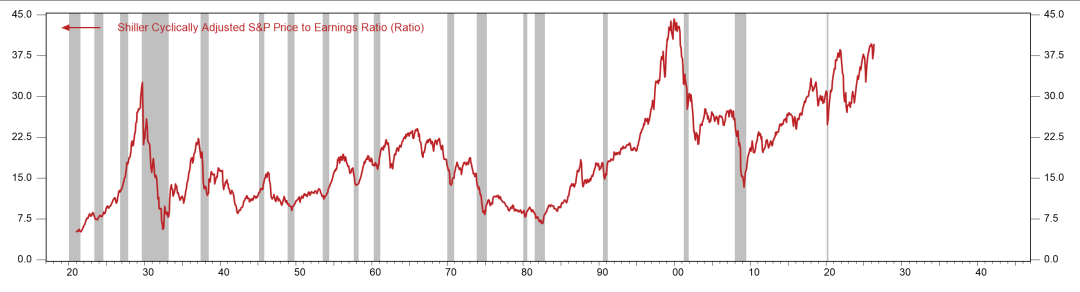
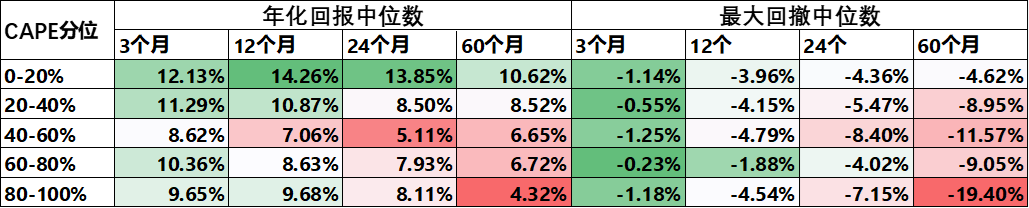
6. In summary, by historical pattern, significant drawdowns in U.S. stocks occur almost every six months, this is the historical norm, and the next six months will likely be no exception. Moreover, given that U.S. equity valuations are at historically high levels, future drawdown magnitudes may even exceed the historical medians.
Disclaimer: The content of this article solely reflects the author's opinion and does not represent the platform in any capacity. This article is not intended to serve as a reference for making investment decisions.
You may also like
Inflation Shocks Wall Street as Selling Pressure Builds: 5 Altcoins to Try Before the Next Major Rally

Analytics Firm Says, “There’s a 90% Chance We’re at the Start of a Bull Market,” and Reveals Its Favorite Altcoins
U.S. Treasury Department’s investigation does not signal reduced bond issuance; U.S. Treasury yields rise as 10-year reclaims 5.12%
In a survey soliciting opinions from primary dealers, the Treasury Department asked about plans for repurchasing long-term government bonds, ways to enhance repo efficiency, the timing of short-term bond issuance, and prospects for the economy and financing, but did not directly address the issue of reducing long-term bond supply. Some investors had expected the Treasury to use this questionnaire to more clearly signal that it is considering scaling back the size of long-term bond auctions or even stopping the issuance of 20-year bonds, in response to the Trump administration's efforts to lower financing costs. The refinancing announcement to be released by the Treasury on November 4 has become the next observation point.
Dogecoin eyes daily death cross in 2026 as price trades near $0.081
Crypto prices
More


