Bitget App
Trade smarter
Buy cryptoMarketsTradeFuturesStocksEarnInstitutionAI & More
Can XTZ Price Escape Its Multi-Year Downtrend?

Can XTZ Price Escape Its Multi-Year Downtrend?

CoinpediaCoinpedia2026/05/09 04:33
By:Coinpedia
Story Highlights
  • Tezos X Previewnet launched May 5 with unified EVM and Michelson execution.

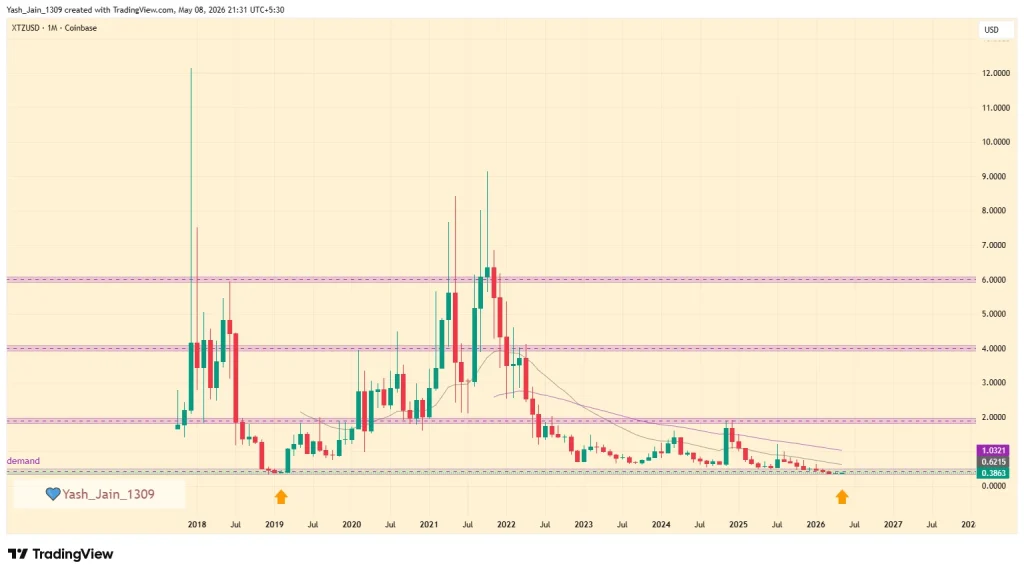
  • XTZ remains near its 2019 historical demand zone around $0.35-$0.50.

  • Governance voting in June 2026 could push Tezos X toward Mainnet launch.

Many traders had written off XTZ as a “ghost chain,” but Tezos surprised them with a genuine technical upgrade rather than a recycled roadmap. The launch of the Tezos X Previewnet on May 5 is suddenly putting the spotlight back on XTZ, especially as the token sits deep inside a historical demand zone around $0.35-$0.50.

And yeah, after a brutal decline since 2021, that’s either the perfect accumulation range or the world’s longest crypto coma.

Tezos X Removes Bridges From Equation

Here’s the interesting part. Tezos X isn’t another fragmented Layer 2 experiment. The Previewnet introduces a unified execution layer where EVM and Michelson contracts operate on the same ledger. In plain English: no bridges, no wrapped assets, and fewer moving parts waiting to implode during peak volatility.

The system allows atomic transactions across Solidity and Michelson contracts in one block. If one side fails, the entire transaction rolls back. That’s the kind of infrastructure pitch developers actually care about.

Tezos X Previewnet is live.

This testnet is your first chance to get hands-on with the Tezos X architecture, start building, start testing, and help refine the experience with your feedback.

Learn more 👇

— Tezos Commons (@TezosCommons) May 5, 2026

Meanwhile, Tezos is evolving Etherlink into the broader Tezos X architecture, letting Solidity developers use familiar tools like Hardhat, Foundry, and MetaMask while tapping into Tezos-native functionality.

XTZ Price Sits At Historic Demand Zone

But let’s be real, technology alone rarely saves a token overnight. XTZ is still down massively from its highs, and even this weekly move barely registers on the larger chart structure.

Still, the technical setup is getting attention. XTZ price is revisiting a 2019 demand area that previously triggered a strong recovery rally. Historically, these zones tend to matter.
Can XTZ Price Escape Its Multi-Year Downtrend? image 0

If demand returns alongside the Tezos X rollout, a move toward the safer-side $2 target doesn’t look impossible. Ambitious? Sure. Impossible? Not yet.

Mainnet Vote Could Decide XTZ Direction

So, what’s next? June 2026 is the real checkpoint. Governance proposals are expected to move Tezos X from Previewnet toward Mainnet deployment if validators approve it.

Then comes the H2 2026 migration toward RISC-V architecture, opening the door for smart contract development in languages like Rust, C++, and potentially Python or JavaScript with improved gas efficiency.

For now though, XTZ still needs one thing crypto narratives can’t fake forever: sustained demand. Without that, the token may simply continue grinding sideways at this demand area while traders keep waiting for the “real” recovery rally.


0
0

Disclaimer: The content of this article solely reflects the author's opinion and does not represent the platform in any capacity. This article is not intended to serve as a reference for making investment decisions.

Understand the market, then trade.
Bitget offers one-stop trading for cryptocurrencies, stocks, and gold.
Trade now!

You may also like

VIPAI Asset Sell-Off and Selective Rotation in Crypto

1. Technology stocks fell sharply as investor interest shifted toward energy and selected defensive assets. From October 10 to 16, the Nasdaq 100 declined 5.49% and the S&P 500 fell 1.95%, while the Dow gained 0.67% and WTI crude rose 10.41%. BTC, ETH, and SOL declined 1.27%, 2.65%, and 4.44%, respectively. This week's technology earnings will be an important test of whether revenue growth, margins, and cash flow can justify current valuations. Better-than-expected results could help stabilize markets in the near term. 2. Crypto continues to see pockets of strong activity, but a broad-based altcoin season has yet to materialize. CoinMarketCap's (CMC) Altcoin Season Index stood at 54 as of the October 18 UTC daily observation, below the altcoin-season threshold of 75, while BTC dominance rose to 60.08%. Our proxy leverage ratio fluctuated between 4.00 and 4.07 during the week, showing no sustained increase and suggesting limited appetite for additional leverage. Meanwhile, as major exchanges expand access to traditional financial assets, the recent sell-off in AI-related equities could attract short-term speculative capital away from crypto. Such capital rotation could make it more difficult for a new altcoin season to take hold. 3. Papertrade's loss-to-mine model has generated significant interest across the crypto community. The protocol combines high-leverage derivatives trading with zero slippage and a mechanism that rewards trading losses with PAPER tokens. Across the eight complete UTC days from October 10 to 17, cumulative reported revenue reached approximately $56.08 million, including $51.90 million distributed to token holders. With growing participation from key opinion leaders (KOLs), Papertrade has reportedly ranked among the top three platforms by profitability in the broader market recently. Assets to watch: BTC, ETH, SOL, ARB, OP, SKHYNIX, SKHY, META, TSLA, LRCX, and SPCX. Key research priorities this week: Cash flow performance in technology earnings; the relative discount and holding costs of the two SK Hynix contracts; and U.S. initial jobless claims and PMI data. Weekly market data cover the period through October 16, while research information was verified through October 18. Observation periods are specified separately for each chart.

Bitget•2026/10/19 06:51
AI Asset Sell-Off and Selective Rotation in Crypto