
SIREN price rally meets sellers at $1.22

SIREN price surged 22% on Binance perpetuals on May 8, hitting $1.2965 before a sharp 4H reversal warned of seller resistance.
- SIREN’s Binance perpetual contract rose 22.82% on May 8, touching a session high of $1.2965 on volume of 139.23M tokens.
- The 4H spot chart on MEXC printed a long upper wick at $1.2207 and reversed 3.11%, signaling sellers stepped in at resistance.
- The daily MA ribbon has fully flipped bullish with all four SMAs stacked below price, but the MACD on the 4H is issuing the first caution flag of the latest rally.
SIREN price posted a 22% gain on Binance perpetuals on May 8 before a 4H reversal flagged seller resistance. The BNB Chain AI-meme token reached a daily high of $1.2965 on the Binance perpetual market on volume of 139.23 million tokens, the highest reading since the April peak, before pulling back to close the session near $1.1626 on the daily candle.
The daily timeframe tells a straightforwardly bullish story. All four moving averages in the MA ribbon — the 20, 50, 100, and 200 SMA — are stacked below price and fanning outward, the classic arrangement of a trend that has regained structure after a correction.
The MACD on the daily chart is crossing positive for the first time since the April peak, with the histogram ticking into green territory and the blue signal line lifting off the zero line.
Where the conflict is
The 4H spot chart on MEXC tells a different story in the short term. Price opened at $1.2089, spiked to a high of $1.2207, and reversed to $1.1724 by the time of the most recent close, a 3.11% intraday loss.
The resulting candle has a clearly defined upper wick at the $1.22 level, indicating sellers absorbed the buying pressure that drove the initial spike.
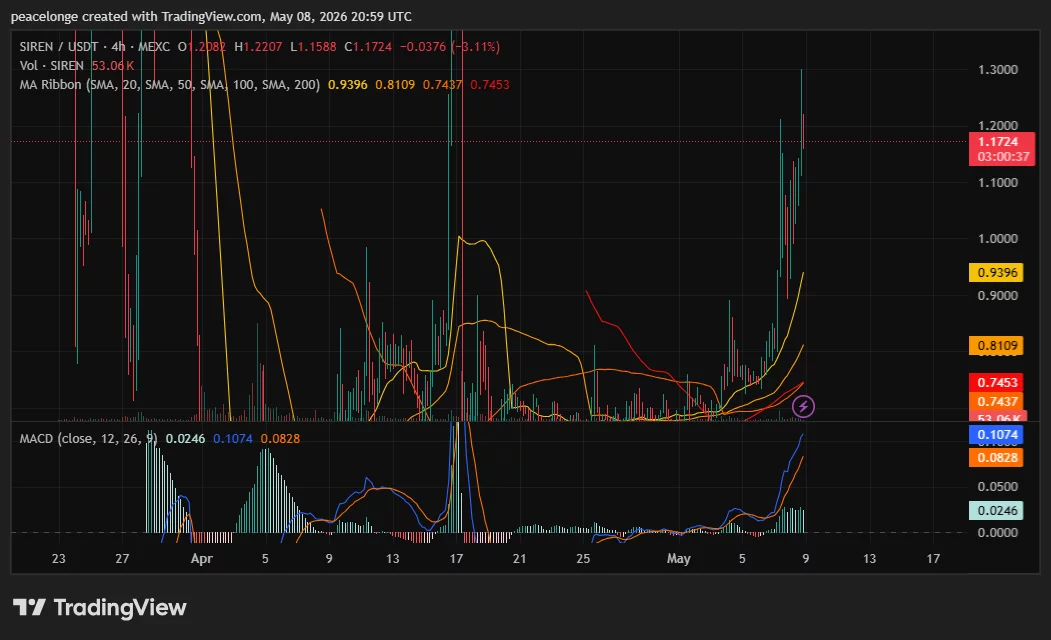
The 4H MACD is rising, with values at 0.0246 on the histogram and 0.1074 on the signal line, but the current red candle introduces the first distribution signal since the May rally began. Volume on the 4H was 53.06K, materially lighter than the spike candles that drove price from the $0.74 MA cluster to above $1.20 in the days prior.
As crypto.news documented, SIREN has a pattern of sharp intraday reversals following rapid moves higher. The token hit an all-time high of approximately $3.61 on March 22, then plunged more than 70% within 48 hours as wallet concentration concerns triggered selling pressure.
The current move is the second major recovery attempt from that collapse, with the token having based in the $0.68 to $0.80 range through most of late April before breaking out again in early May.
Supply and structure context
SIREN is a BNB Chain token that markets itself as an AI-meme hybrid, with a roadmap promising a DEX and an AI trading agent, both currently listed as coming soon on its website.
As crypto.news reported, on-chain researchers have flagged supply concentration concerns throughout the token’s history, with estimates ranging from 48% to 88% of supply controlled by a small cluster of wallets. That overhang has been a recurring driver of the token’s violent downside episodes.
The broader BNB Chain environment remains supportive for AI-themed tokens. BNB Chain surpassed 150,000 autonomous AI agent deployments in April 2026, growing 43,750% since January and establishing itself as the dominant chain for on-chain AI activity. SIREN’s AI narrative sits inside that tailwind, though its promised products remain undelivered.
The immediate technical question is whether $1.22 holds as the first meaningful resistance level on the 4H or whether buyers can reclaim it on the next session to set up a continuation toward the next visible supply zone near $1.30.
Disclaimer: The content of this article solely reflects the author's opinion and does not represent the platform in any capacity. This article is not intended to serve as a reference for making investment decisions.
You may also like
 VIPAI Asset Sell-Off and Selective Rotation in Crypto
1. Technology stocks fell sharply as investor interest shifted toward energy and selected defensive assets. From October 10 to 16, the Nasdaq 100 declined 5.49% and the S&P 500 fell 1.95%, while the Dow gained 0.67% and WTI crude rose 10.41%. BTC, ETH, and SOL declined 1.27%, 2.65%, and 4.44%, respectively. This week's technology earnings will be an important test of whether revenue growth, margins, and cash flow can justify current valuations. Better-than-expected results could help stabilize markets in the near term. 2. Crypto continues to see pockets of strong activity, but a broad-based altcoin season has yet to materialize. CoinMarketCap's (CMC) Altcoin Season Index stood at 54 as of the October 18 UTC daily observation, below the altcoin-season threshold of 75, while BTC dominance rose to 60.08%. Our proxy leverage ratio fluctuated between 4.00 and 4.07 during the week, showing no sustained increase and suggesting limited appetite for additional leverage. Meanwhile, as major exchanges expand access to traditional financial assets, the recent sell-off in AI-related equities could attract short-term speculative capital away from crypto. Such capital rotation could make it more difficult for a new altcoin season to take hold. 3. Papertrade's loss-to-mine model has generated significant interest across the crypto community. The protocol combines high-leverage derivatives trading with zero slippage and a mechanism that rewards trading losses with PAPER tokens. Across the eight complete UTC days from October 10 to 17, cumulative reported revenue reached approximately $56.08 million, including $51.90 million distributed to token holders. With growing participation from key opinion leaders (KOLs), Papertrade has reportedly ranked among the top three platforms by profitability in the broader market recently. Assets to watch: BTC, ETH, SOL, ARB, OP, SKHYNIX, SKHY, META, TSLA, LRCX, and SPCX. Key research priorities this week: Cash flow performance in technology earnings; the relative discount and holding costs of the two SK Hynix contracts; and U.S. initial jobless claims and PMI data. Weekly market data cover the period through October 16, while research information was verified through October 18. Observation periods are specified separately for each chart.

Why Bernstein Thinks the AI Stock Sell-Off Could Help Small Caps

Morgan Stanley Builds Crypto Lab to Test Stablecoins, Tokenization and DeFi at Scale

Top 4 Earnings Reports This Week: What Tesla, Meta, SpaceX, Netflix Must Show
Crypto prices
More


