
XRP Network Quiet: Adoption & Activity Plunge From 2024 Peak

By:Newsbtc
Bitget offers one-stop trading for cryptocurrencies, stocks, and gold. Trade now!
A welcome pack worth 6200 USDT for new users! Sign up now!
Data shows the XRP blockchain has seen a steep drop in metrics related to activity and adoption, indicating that the earlier speculative wave has faded.
XRP New Addresses & Active Supply Have Both Plummeted
In a new post on X, on-chain analytics firm Glassnode has talked about the latest trends in the new addresses and monthly active supply of XRP. The former metric is a measure of the daily total number of wallets coming online on the blockchain for the first time, while the latter tracks the amount of the cryptocurrency’s supply that became involved in at least one transaction over the past month.

First, here is a chart that shows how the number of new addresses has fluctuated on the XRP network over the last few years:
var rnd = window.rnd || Math.floor(Math.random()*10e6); var pid607465 = window.pid607465 || rnd; var plc607465 = window.plc607465 || 0; var abkw = window.abkw || ''; var absrc = 'https://servedbyadbutler.com/adserve/;ID=172179;size=0x0;setID=607465;type=js;sw='+screen.width+';sh='+screen.height+';spr='+window.devicePixelRatio+';kw='+abkw+';pid='+pid607465+';place='+(plc607465++)+';rnd='+rnd+';click=CLICK_MACRO_PLACEHOLDER'; document.write('
');
if (!window.AdButler){(function(){var s = document.createElement("script"); s.async = true; s.type = "text/javascript";s.src = "https://servedbyadbutler.com/app.js";var n = document.getElementsByTagName("script")[0]; n.parentNode.insertBefore(s, n);}());}
var AdButler = AdButler || {}; AdButler.ads = AdButler.ads || []; var abkw = window.abkw || ""; var plc366606 = window.plc366606 || 0; (function(){ var divs = document.querySelectorAll(".plc366606:not([id])"); var div = divs[divs.length-1]; div.id = "placement_366606_"+plc366606; AdButler.ads.push({handler: function(opt){ AdButler.register(172179, 366606, [728,90], "placement_366606_"+opt.place, opt); }, opt: { place: plc366606++, keywords: abkw, domain: "servedbyadbutler.com", click:"CLICK_MACRO_PLACEHOLDER" }}); })();
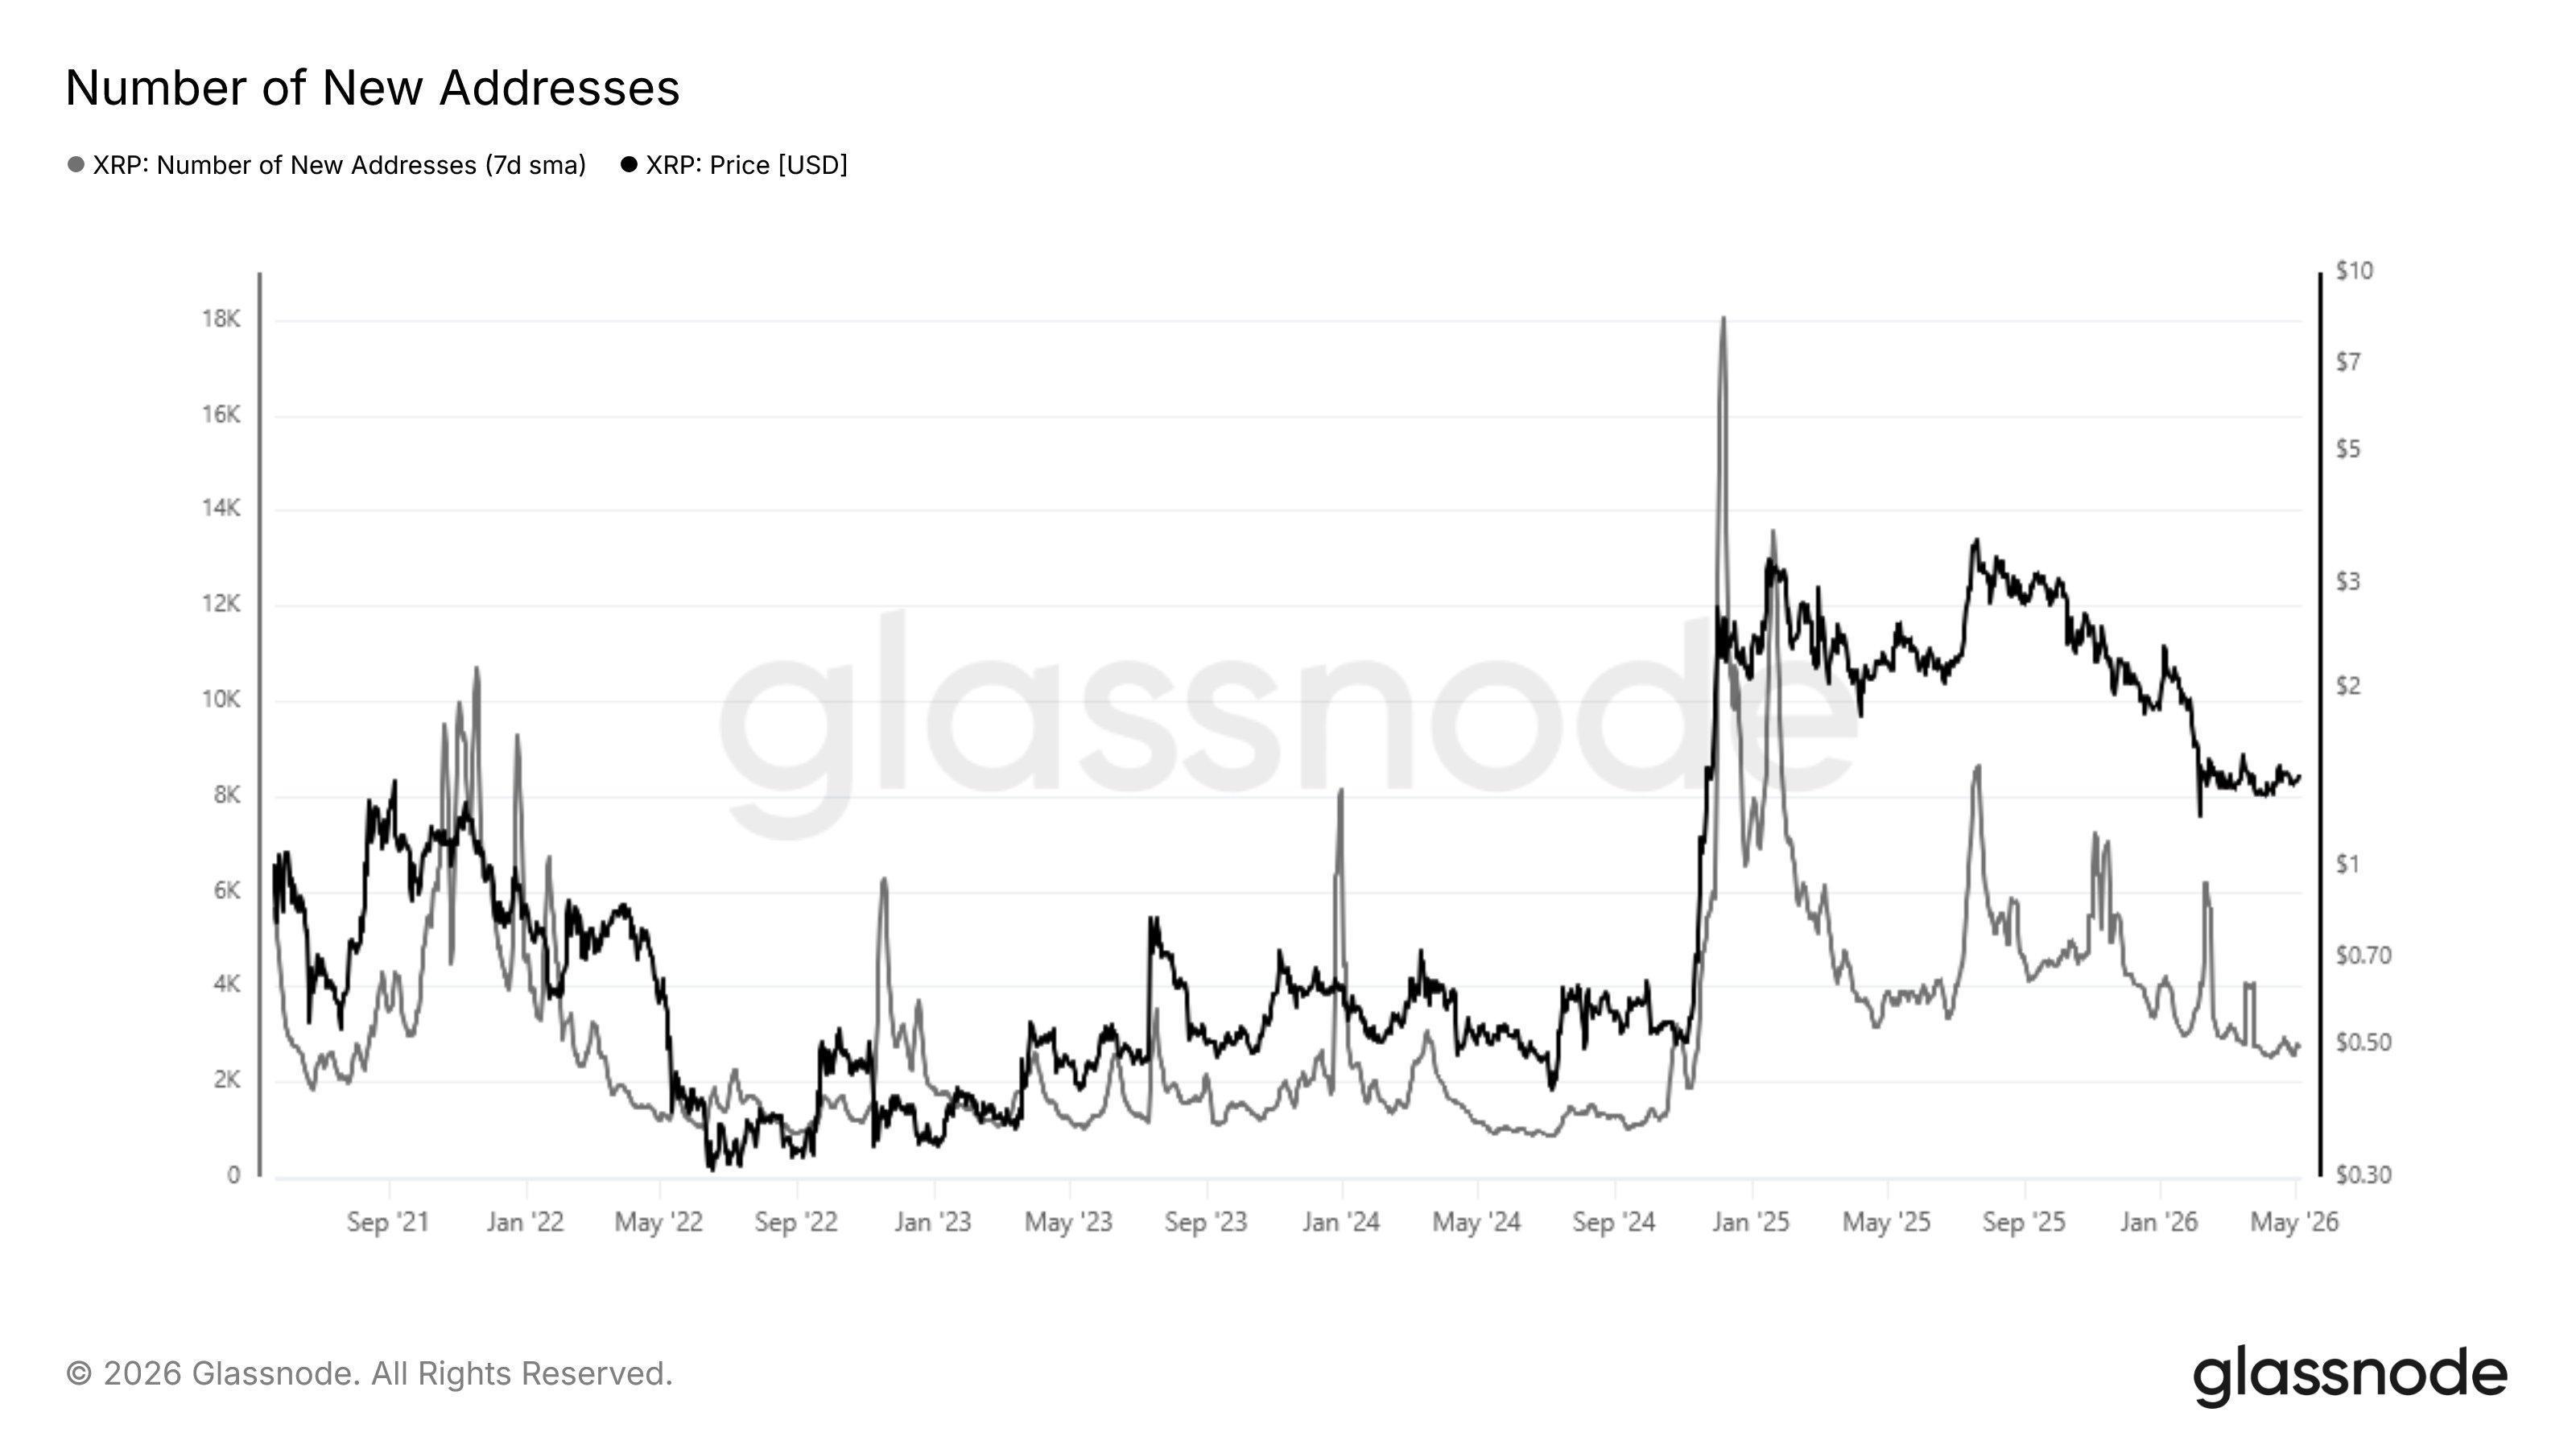 Looks like the value of the metric has gone down in recent months | Source:
Glassnode on X
As displayed in the above graph, the 7-day average number of new addresses popping up on the XRP network shot up to a peak in late 2024. This massive spike in the metric appeared alongside a sharp bull rally for the cryptocurrency. Thus, it would appear that the bullish momentum was accompanied by a surge in adoption.
From the chart, it’s visible that what followed the explosive influx of new investors was a significant cooldown in the metric during 2025. Adoption still saw some spikes, but they were of a notably lower level than the December 2024 high.
In 2026, the decline in the indicator has only furthered. Today, there are just 2,700 new addresses joining the network every day. This reflects a drop of 85% compared to the December 2024 peak, when the metric reached a value of 18,000.
var rnd = window.rnd || Math.floor(Math.random()*10e6); var pid607472 = window.pid607472 || rnd; var plc607472 = window.plc607472 || 0; var abkw = window.abkw || ''; var absrc = 'https://servedbyadbutler.com/adserve/;ID=172179;size=0x0;setID=607472;type=js;sw='+screen.width+';sh='+screen.height+';spr='+window.devicePixelRatio+';kw='+abkw+';pid='+pid607472+';place='+(plc607472++)+';rnd='+rnd+';click=CLICK_MACRO_PLACEHOLDER'; document.write('
');
if (!window.AdButler){(function(){var s = document.createElement("script"); s.async = true; s.type = "text/javascript";s.src = "https://servedbyadbutler.com/app.js";var n = document.getElementsByTagName("script")[0]; n.parentNode.insertBefore(s, n);}());}
var AdButler = AdButler || {}; AdButler.ads = AdButler.ads || []; var abkw = window.abkw || ""; var plc452518 = window.plc452518 || 0; (function(){ var divs = document.querySelectorAll(".plc452518:not([id])"); var div = divs[divs.length-1]; div.id = "placement_452518_"+plc452518; AdButler.ads.push({handler: function(opt){ AdButler.register(172179, 452518, [728,90], "placement_452518_"+opt.place, opt); }, opt: { place: plc452518++, keywords: abkw, domain: "servedbyadbutler.com", click:"CLICK_MACRO_PLACEHOLDER" }}); })();
Adoption isn’t the only metric that has slowed down for XRP. As the data of the other indicator shared by Glassnode shows, the 7-day average value of the monthly active supply has also plummeted.
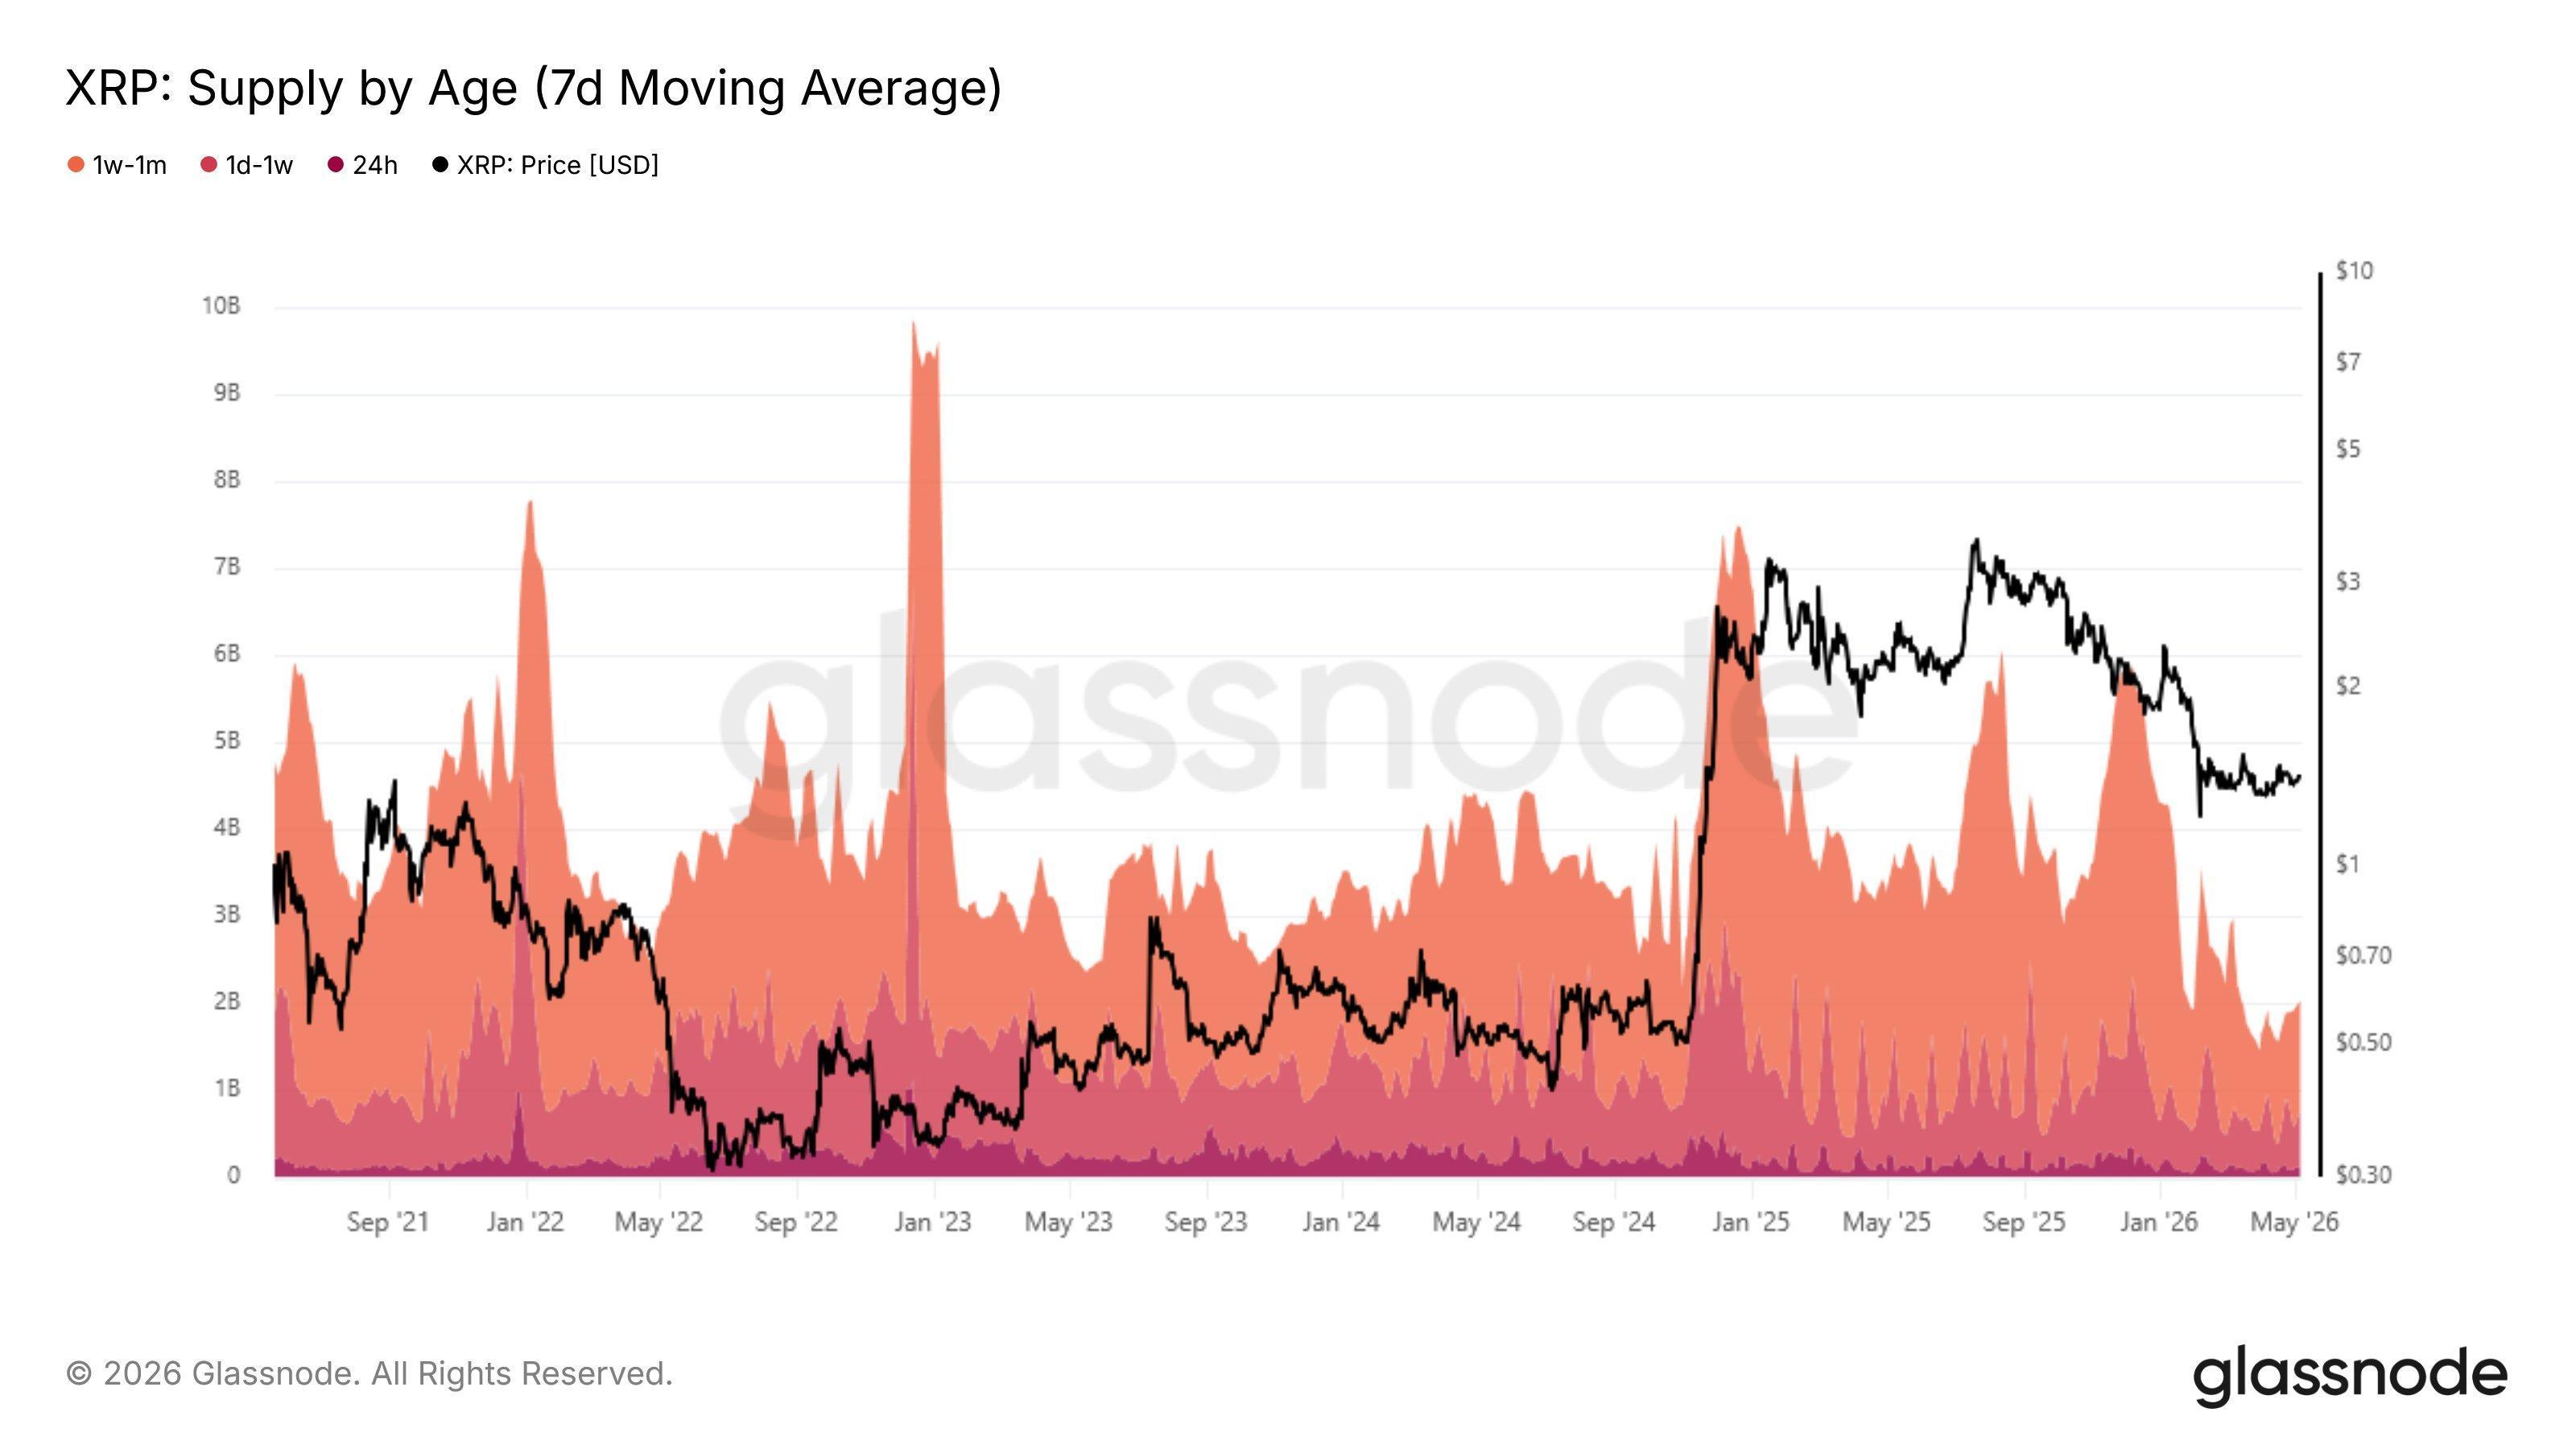 The trend in the XRP active supply over the past few years | Source:
Glassnode on X
As is apparent from the chart, activity on the network also witnessed a major spike alongside the bullish price action of late 2024, with 7.45 billion tokens becoming part of the 1-month active supply. Following the bearish market shift since Q4 2025, the indicator has noted a sharp drop for XRP. Currently, just 2 billion tokens make up this segment of the cryptocurrency’s supply, which is lower than even the lows from the 2022 bear market.
“The speculative wave that drove XRP’s late-2024 surge has largely unwound at the network level,” explained the analytics firm. It now remains to be seen whether the quiet on the network will persist in the near future or if another shift will arrive.
var rnd = window.rnd || Math.floor(Math.random()*10e6); var pid607473 = window.pid607473 || rnd; var plc607473 = window.plc607473 || 0; var abkw = window.abkw || ''; var absrc = 'https://servedbyadbutler.com/adserve/;ID=172179;size=0x0;setID=607473;type=js;sw='+screen.width+';sh='+screen.height+';spr='+window.devicePixelRatio+';kw='+abkw+';pid='+pid607473+';place='+(plc607473++)+';rnd='+rnd+';click=CLICK_MACRO_PLACEHOLDER'; document.write('
');
if (!window.AdButler){(function(){var s = document.createElement("script"); s.async = true; s.type = "text/javascript";s.src = 'https://servedbyadbutler.com/app.js';var n = document.getElementsByTagName("script")[0]; n.parentNode.insertBefore(s, n);}());}
var AdButler = AdButler || {}; AdButler.ads = AdButler.ads || []; var abkw = window.abkw || ''; var plc452519 = window.plc452519 || 0; (function(){ var divs = document.querySelectorAll(".plc452519:not([id])"); var div = divs[divs.length-1]; div.id = "placement_452519_"+plc452519; AdButler.ads.push({handler: function(opt){ AdButler.register(172179, 452519, [728,90], 'placement_452519_'+opt.place, opt); }, opt: { place: plc452519++, keywords: abkw, domain: 'servedbyadbutler.com', click:'CLICK_MACRO_PLACEHOLDER' }}); })();
Related Reading: XRP Nears Triangle Apex—Will A Breakout To $1.80 Follow?
XRP Price
XRP surged to a high above $1.45 on Wednesday, but the coin has since retraced to the $1.38 level.
The price of the coin has erased its recovery | Source:
XRPUSDT on TradingView
0
0
Disclaimer: The content of this article solely reflects the author's opinion and does not represent the platform in any capacity. This article is not intended to serve as a reference for making investment decisions.
Understand the market, then trade.
Bitget offers one-stop trading for cryptocurrencies, stocks, and gold.
Trade now!
You may also like
JPMorgan Brings JPM Coin to Ethereum for Institutions
Coinomedia•2026/10/19 09:30

How Ethereum Could Stay Secure Even If Today’s Online Locks Stop Working
Coinedition•2026/10/19 07:36

Cardano Price Prediction: Can ADA Defend $0.22 as Hoskinson Builds a New Programming Language?
CoinEdition•2026/10/19 07:30
 VIPAI Asset Sell-Off and Selective Rotation in Crypto
1. Technology stocks fell sharply as investor interest shifted toward energy and selected defensive assets. From October 10 to 16, the Nasdaq 100 declined 5.49% and the S&P 500 fell 1.95%, while the Dow gained 0.67% and WTI crude rose 10.41%. BTC, ETH, and SOL declined 1.27%, 2.65%, and 4.44%, respectively. This week's technology earnings will be an important test of whether revenue growth, margins, and cash flow can justify current valuations. Better-than-expected results could help stabilize markets in the near term. 2. Crypto continues to see pockets of strong activity, but a broad-based altcoin season has yet to materialize. CoinMarketCap's (CMC) Altcoin Season Index stood at 54 as of the October 18 UTC daily observation, below the altcoin-season threshold of 75, while BTC dominance rose to 60.08%. Our proxy leverage ratio fluctuated between 4.00 and 4.07 during the week, showing no sustained increase and suggesting limited appetite for additional leverage. Meanwhile, as major exchanges expand access to traditional financial assets, the recent sell-off in AI-related equities could attract short-term speculative capital away from crypto. Such capital rotation could make it more difficult for a new altcoin season to take hold. 3. Papertrade's loss-to-mine model has generated significant interest across the crypto community. The protocol combines high-leverage derivatives trading with zero slippage and a mechanism that rewards trading losses with PAPER tokens. Across the eight complete UTC days from October 10 to 17, cumulative reported revenue reached approximately $56.08 million, including $51.90 million distributed to token holders. With growing participation from key opinion leaders (KOLs), Papertrade has reportedly ranked among the top three platforms by profitability in the broader market recently. Assets to watch: BTC, ETH, SOL, ARB, OP, SKHYNIX, SKHY, META, TSLA, LRCX, and SPCX. Key research priorities this week: Cash flow performance in technology earnings; the relative discount and holding costs of the two SK Hynix contracts; and U.S. initial jobless claims and PMI data. Weekly market data cover the period through October 16, while research information was verified through October 18. Observation periods are specified separately for each chart.
Bitget•2026/10/19 06:51

Crypto prices
More
Bitcoin
BTC
$82,896.24
+1.20%

Ethereum
ETH
$2,438.73
+0.85%

Tether USDt
USDT
$0.9990
+0.03%

BNB
BNB
$726.18
+0.77%

XRP
XRP
$1.32
+1.40%

USDC
USDC
$1.0000
+0.01%

Solana
SOL
$105.78
+1.94%

TRON
TRX
$0.3307
-0.67%

Hyperliquid
HYPE
$80.07
+1.52%

Zcash
ZEC
$1,169.56
+3.41%
How to buy BTC
Bitget lists BTC – Buy or sell BTC quickly on Bitget!
Trade now
Become a trader now?A welcome pack worth 6200 USDT for new users!
Sign up now