
Apple FY2026 Q2 Earnings Highlights: Record Revenue and EPS, Q3 Guidance Tops Expectations
 Bitget2026/05/01 02:18
Core Highlights
Apple (AAPL) reported fiscal 2026 second quarter (ended March 28) results with both revenue and EPS reaching record highs for the period. Revenue grew 16.6% year-over-year and EPS rose 21.8%, both exceeding analyst expectations. iPhone revenue increased 22% and slightly beat estimates, while Services continued to set new quarterly records. Greater China revenue surged 28%, far above expectations, though Americas and Europe underperformed. Apple raised its dividend by 4% and authorized an additional $100 billion in share buybacks. Q3 revenue guidance of 14%-17% growth significantly beat the market’s 9.1% expectation, driving after-hours shares up over 4% at one point.
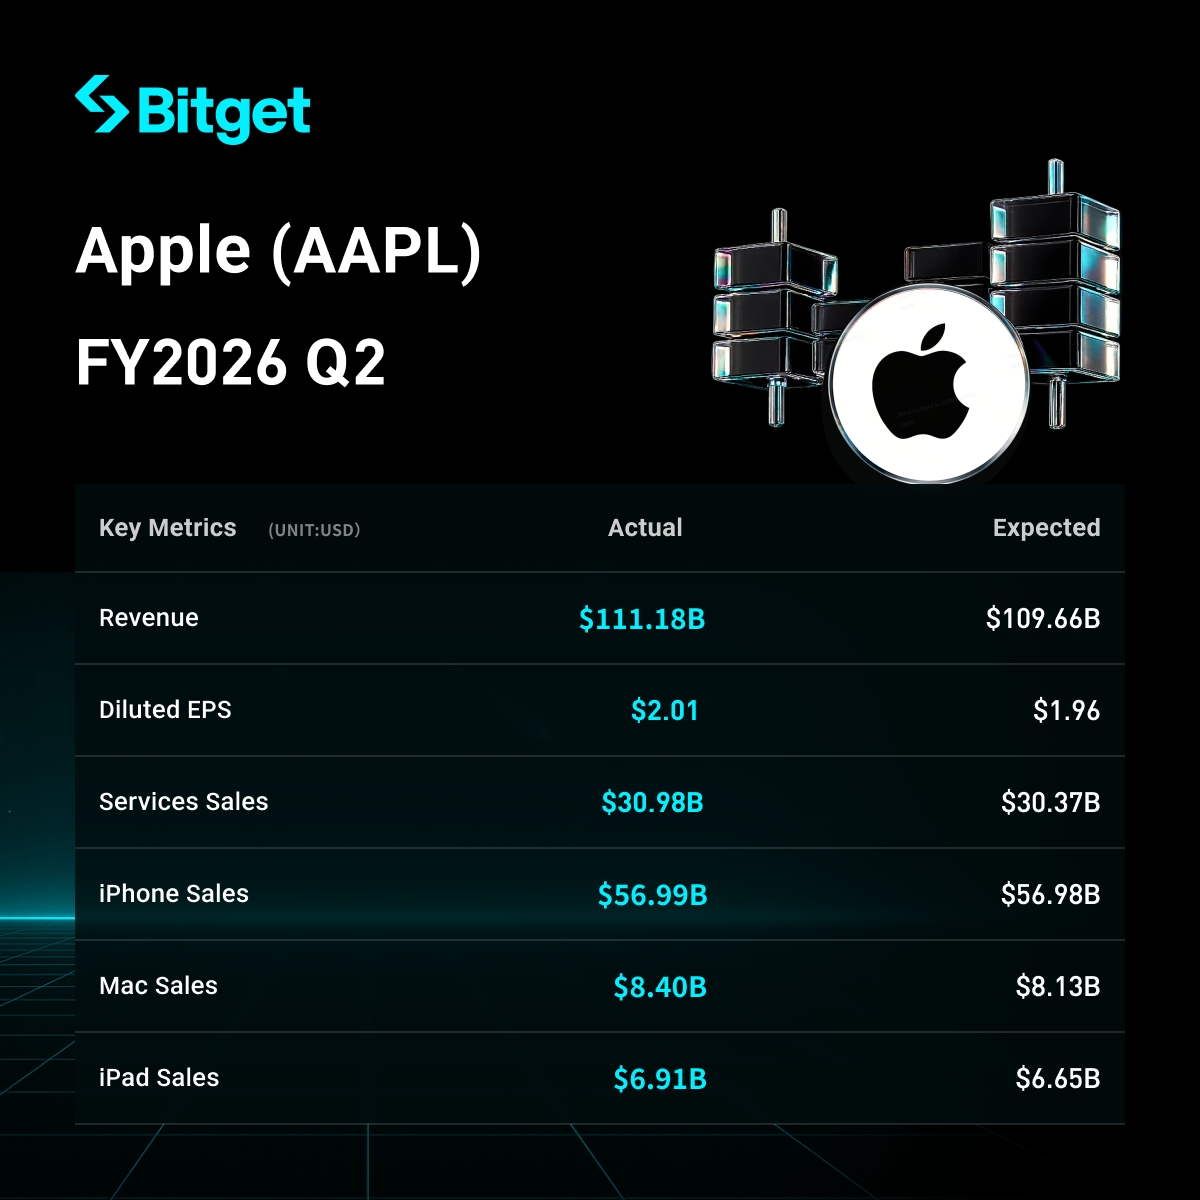
Detailed Breakdown
- Overall Revenue and Profit Performance
- Total revenue: $111.18 billion, +16.6% YoY (above consensus $109.66 billion).
- Products revenue: $80.21 billion, +17% YoY (above $79.26 billion expected).
- Services revenue: $30.98 billion, +16% YoY (above $30.37 billion expected).
- Net income: $29.58 billion, +19% YoY.
- Diluted EPS: $2.01, +21.8% YoY (above $1.96 expected).
- Gross margin: ~49.3% (vs. 47.0% a year ago and 48.5% last quarter).
- Operating cash flow: Over $28 billion, a new record for a March quarter.
- iPhone Business Performance
- iPhone revenue: $56.99 billion, +22% YoY, record high for the period and over half of total revenue.
- Slightly above analyst average estimate of $56.98 billion, driven by strong demand for iPhone 17 series.
- Key driver: Robust high-end model demand, though the beat was modest and limited market enthusiasm.
- Other Business Segments Performance
- Services: Revenue $30.98 billion, +16.3% YoY, setting new quarterly records for over three years; gross margin near 77%, serving as the profit engine. Installed base of active devices reached an all-time high.
- Mac: Revenue $8.40 billion, +6% YoY (above $8.13 billion expected).
- iPad: Revenue $6.91 billion, +8% YoY (above $6.65 billion expected).
- Wearables, Home and Accessories: Revenue $7.90 billion, +5% YoY (above $7.72 billion expected).
- Geographic Performance:
- Greater China: $20.50 billion, +28% YoY (well above $18.91 billion expected).
- Americas: $45.09 billion, +12% YoY (below $45.82 billion expected).
- Europe: $28.06 billion, +15% YoY (below $29.08 billion expected).
- Japan: $8.40 billion, +15% YoY (above $7.38 billion expected).
- Rest of Asia Pacific: $9.14 billion, +25% YoY (above $8.76 billion expected).
- Capital Return and Cash Flow Plans
- Quarterly dividend increased 4% to $0.27 per share.
- Additional share repurchase authorization of up to $100 billion.
- Cash and cash equivalents: $45.57 billion (vs. $35.93 billion at prior fiscal year-end); total cash and marketable securities ~$146.6 billion, interest-bearing debt ~$84.7 billion.
- Operating cash flow for the first six months: $82.63 billion (significantly higher than $53.887 billion a year ago).
- Next Quarter Guidance (Fiscal 2026 Q3)
- Revenue growth: +14% to +17% YoY (well above consensus expectation of +9.1%).
- Gross margin guidance: 47.5%-48.5%.
- Key drivers: Strong product and services demand, along with favorable pricing and mix.
- Market Context and Investor Concerns
- Key positives: Strong China recovery, robust Services growth, record cash flow, and upbeat guidance.
- Offsets: iPhone only marginally beat expectations, weaker Americas/Europe performance, and faster OpEx growth (especially R&D +34% YoY).
- Investor reaction: Shares fell over 1% immediately after the report, then surged over 4% after guidance, reflecting high market expectations for an “explosive” iPhone beat.
- Concerns: Rising chip costs, expense growth outpacing revenue in some areas, and regional divergence, partially offset by Services ecosystem strength and buybacks.
Right now, Bitget's limited-time promotions are live!
I. [Weekly 0 Fees Draw - Phase 6] US Stock Contracts Trading Event Click here to join directly!
- Lifetime 0 trading fees on US stock contracts + weekly draws with non-stop prizes
- Participate to win free shares of hot US stocks like TSLA, NVDA, and more
II. [Earnings Season Exclusive] Copy Trading / Follow Trading on Stock Contracts 30,000 USDT Prize Pool being distributed Click here to join directly!
Disclaimer: This content is for reference only and does not constitute any investment advice.
Disclaimer: The content of this article solely reflects the author's opinion and does not represent the platform in any capacity. This article is not intended to serve as a reference for making investment decisions.
You may also like
VeChain Slides 8.3%: Is This a Healthy Correction or a Bigger Warning Sign?
Stablecoin supply has stalled in 2026, but payments rose by 45% to $480B: Report

The most dangerous divergence in U.S. stocks: ordinary stocks have already plummeted, how much longer can AI giants hold on?
Significantly tightened financial conditions are heavily impacting ordinary stocks in the US stock market, with the median S&P 500 constituent falling 15% from its peak and the equity risk premium dropping below zero. Rising US Treasury yields and oil prices have pushed the financial conditions index sharply higher, resulting in a severe deterioration in breadth beneath the apparent calm of the index. Market divergence is intensifying, raising the core uncertainty of whether ordinary stocks will catch up or the index will converge downward.

Will APT’s price clear $0.87 after Aptos’s launch of Block-STM v2 upgrade?

Crypto prices
More


