
Rumors of US-Iran dialogue channels closing disturb the market! Gold fluctuates at high levels, technical indicators show a bearish signal

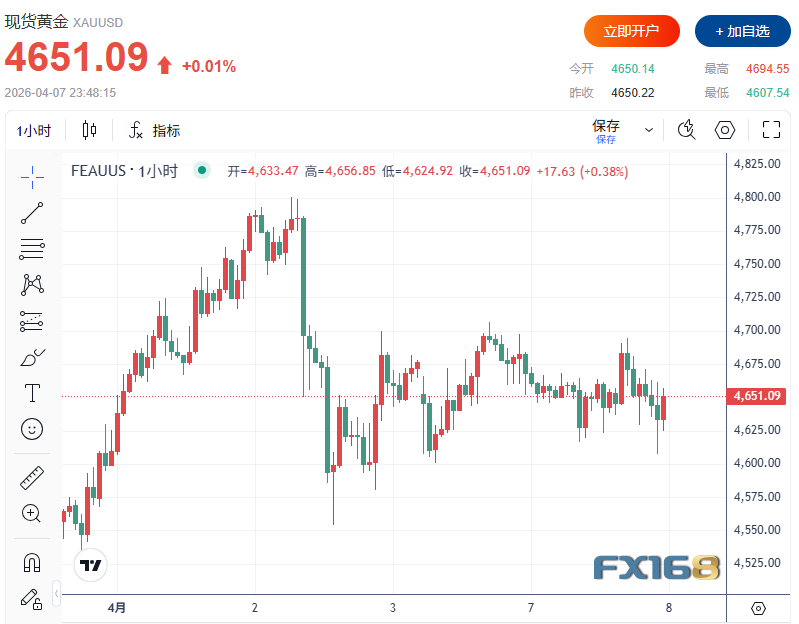
On Tuesday (April 7), spot gold (XAU/USD) maintained a high-level consolidation trend. As the deadline set by US President Trump for the Iran issue draws near, market sentiment has clearly turned more cautious. At the time of writing, gold prices are trading near $4,651, overall lacking a clear direction, with traders closely monitoring the latest news on whether the US and Iran can reach a ceasefire or compromise arrangement.
(Image source: FX168)
The market awaits the outcome of Trump’s “ultimatum” to Iran
Before this critical moment, investors have mostly chosen to stay on the sidelines. Trump previously demanded that Iran must "reach an agreement, or open the Strait of Hormuz" by 8pm US Eastern Time (UTC+8) on Tuesday. He also warned that if no consensus is reached, the US may target Iran’s energy and civilian infrastructure for strikes.
According to a Reuters report on Tuesday citing a senior Iranian official, if the situation continues to escalate, Iran’s allies may push for the closure of the Bab el-Mandeb Strait. Meanwhile, The Tehran Times reported that Iran had cut off all diplomatic and indirect communication channels with the US. However, less than two hours later, The Tehran Times posted that the diplomatic and indirect dialogue channels between Iran and the US were not closed, and deleted the previous story. #IranCrisisTracking#
The market had been hopeful for a ceasefire, but this optimism quickly faded. On Monday, the Islamic Republic News Agency (IRNA) reported that Tehran rejected the ceasefire proposal relayed via Pakistan, and instead put forward a 10-point plan; its key demands included a permanent end to the war, lifting sanctions, and establishing a formal mechanism ensuring free passage through the Strait of Hormuz. Trump called Iran’s proposal “a very significant step,” but said it was “still not good enough.”
Dollar and oil climb, dampening gold’s safe-haven appeal
Despite continued geopolitical risks, gold has not consistently attracted strong safe-haven buying. One core reason is the persistent strength of the US dollar, as global liquidity demand is currently outweighing traditional safe-haven flows into gold.
In other words, while gold is supported by risk aversion, the strong dollar is partially offsetting these bullish factors, resulting in a tug-of-war around high prices.
On the other hand, rising oil prices are exerting additional pressure on gold. Higher crude adds to inflation concerns and increases economic growth risks, furthering bets that major central banks—especially the Federal Reserve—will keep interest rates elevated for longer.
This concern is likely to be reflected in the upcoming release of US March inflation data later this week. Economists expect the US March CPI monthly rate to rise to 0.9% (UTC+8), notably higher than February’s 0.3%; the annual rate is expected to reach 3.3%, up from the previous 2.4%.
Currently, the market has basically ruled out the probability of rate cuts this year; earlier, there was an expectation of at least two cuts. For gold, which does not yield returns, this undoubtedly forms a clear headwind.
Central bank buying supports the case for a medium-to-long-term gold rally
Although gold faces short-term headwinds, its medium to long-term outlook remains optimistic. The structural factors supporting gold prices are still present, including continued global central bank gold purchases, rising sovereign debt in major economies, and resilient retail demand via exchange-traded funds (ETFs).
According to Bloomberg, the People’s Bank of China increased its gold holdings by about 160,000 troy ounces in March, roughly 5 tons, marking the 17th consecutive month of accumulation. Meanwhile, estimates from the World Gold Council (WGC) show that in the first two months of the year, central banks around the world made net gold purchases totaling 25 tons.
This means that although gold prices in the short term may be constrained by the dollar, interest rate expectations, and oil price fluctuations, steady official sector buying continues to provide a solid medium-to-long-term support for gold.
Technical analysis: Bear flag emerges on 4-hour chart, downside risk accumulates
According to financial website FXStreet, at the technical level, gold’s 4-hour chart is forming a bear flag pattern. As prices edge closer to the lower edge of the formation, short-term downside risks are increasing.
To the upside, the 100-period simple moving average (SMA) is near $4,654 and remains a significant resistance, repeatedly capping attempts to break higher. If gold prices can break through this level, the next target would be the region around the 200-period SMA at $4,908.
To the downside, the 50-period SMA is near $4,585, providing some support for now. However, if gold falls consistently below this level, further downside space may open up, targeting the $4,400 area, or possibly even extending towards $4,100.
In terms of momentum indicators, signals are still relatively neutral. The Relative Strength Index (RSI) is hovering around 50, showing the market has yet to form a clear direction; the MACD histogram remains below the zero line, with the MACD line below the signal line and near the zero axis, indicating the presence of downward momentum, but selling pressure has not yet expanded significantly.
Disclaimer: The content of this article solely reflects the author's opinion and does not represent the platform in any capacity. This article is not intended to serve as a reference for making investment decisions.
You may also like
The 10-year US Treasury yield approaches 5.4%, with the AI halo unable to hide the "inflated" risks of the S&P 500
Behind the S&P 500's record high, only 30% of its constituent stocks are above their 50-day moving average, marking the narrowest market breadth at a record high since 1990. The Russell 2000 has fallen for five consecutive weeks, and high-yield bond yields have soared to 15%. Societe Generale warns that if US Treasury yields rise to 6% and oil prices reach $150, the S&P 500 could fall by more than 20% next year. In addition, some top-performing fund managers have completely exited AI stocks in favor of energy, stating that once financing dries up, it will be "game over."
Oil tanker freight reaches a sixty-year high: shipping oil from the US to China is more expensive than launching a rocket!
The freight for a single barrel of crude oil has soared to $41, approaching half the oil price, and for a single trip, the freight was once enough to buy an oil tanker. The Middle East crisis has led to a structural shortage of shipping capacity in the Strait of Hormuz, coupled with ship-to-ship transfers extending turnaround times. VLCC freight rates have skyrocketed from an annual average of $9.2 million to $77 million—an increase of more than eight times. Refiners’ profits are being rapidly eroded, the average price of second-hand oil tankers has reached a historic high, and, unusually, surpassed the price of new vessels.

Following the Drop but Not the Rise! Silver Trapped in Difficulties
The logic of AI and solar energy demand continues to play out, yet prices are falling against the trend—macroeconomic forces such as a strengthening US dollar and rising real interest rates have completely suppressed fundamentals. Speculative funds offloaded $1.6 billion in a single week, marking a yearly peak, while CTA net short positions reversed by $2.6 billion to the highest level this year. However, Goldman Sachs analysts believe that the extreme short positioning itself is building reversal momentum, highlighting an asymmetry; once macro headwinds subside, a retaliatory rebound could be easily triggered. After a similar shakeout last time, silver surged 15% in six weeks.
Crypto prices
More


