
Traders pricing in TACO trade may be in for 'rude awakening' — Analyst

Traders are miscalculating the severity and the duration of economic fallout from the Middle East conflict and are pricing in a “TACO” trade, which stands for “Trump always chickens out,” according to market analyst and founder of the Coin Bureau, Nic Puckrin.
The term was coined by Wall Street and refers to US President Donald Trump backing down in geopolitical conflicts. However, Puckrin warned that “Trump is not in sole control of the situation,” and there are no easy or quick exits from the war.
If oil continues to trade above $100 per barrel, economic growth will slow, and Personal Consumption Expenditures (PCE) inflation will rise by up to 1 percentage point, Puckrin said.
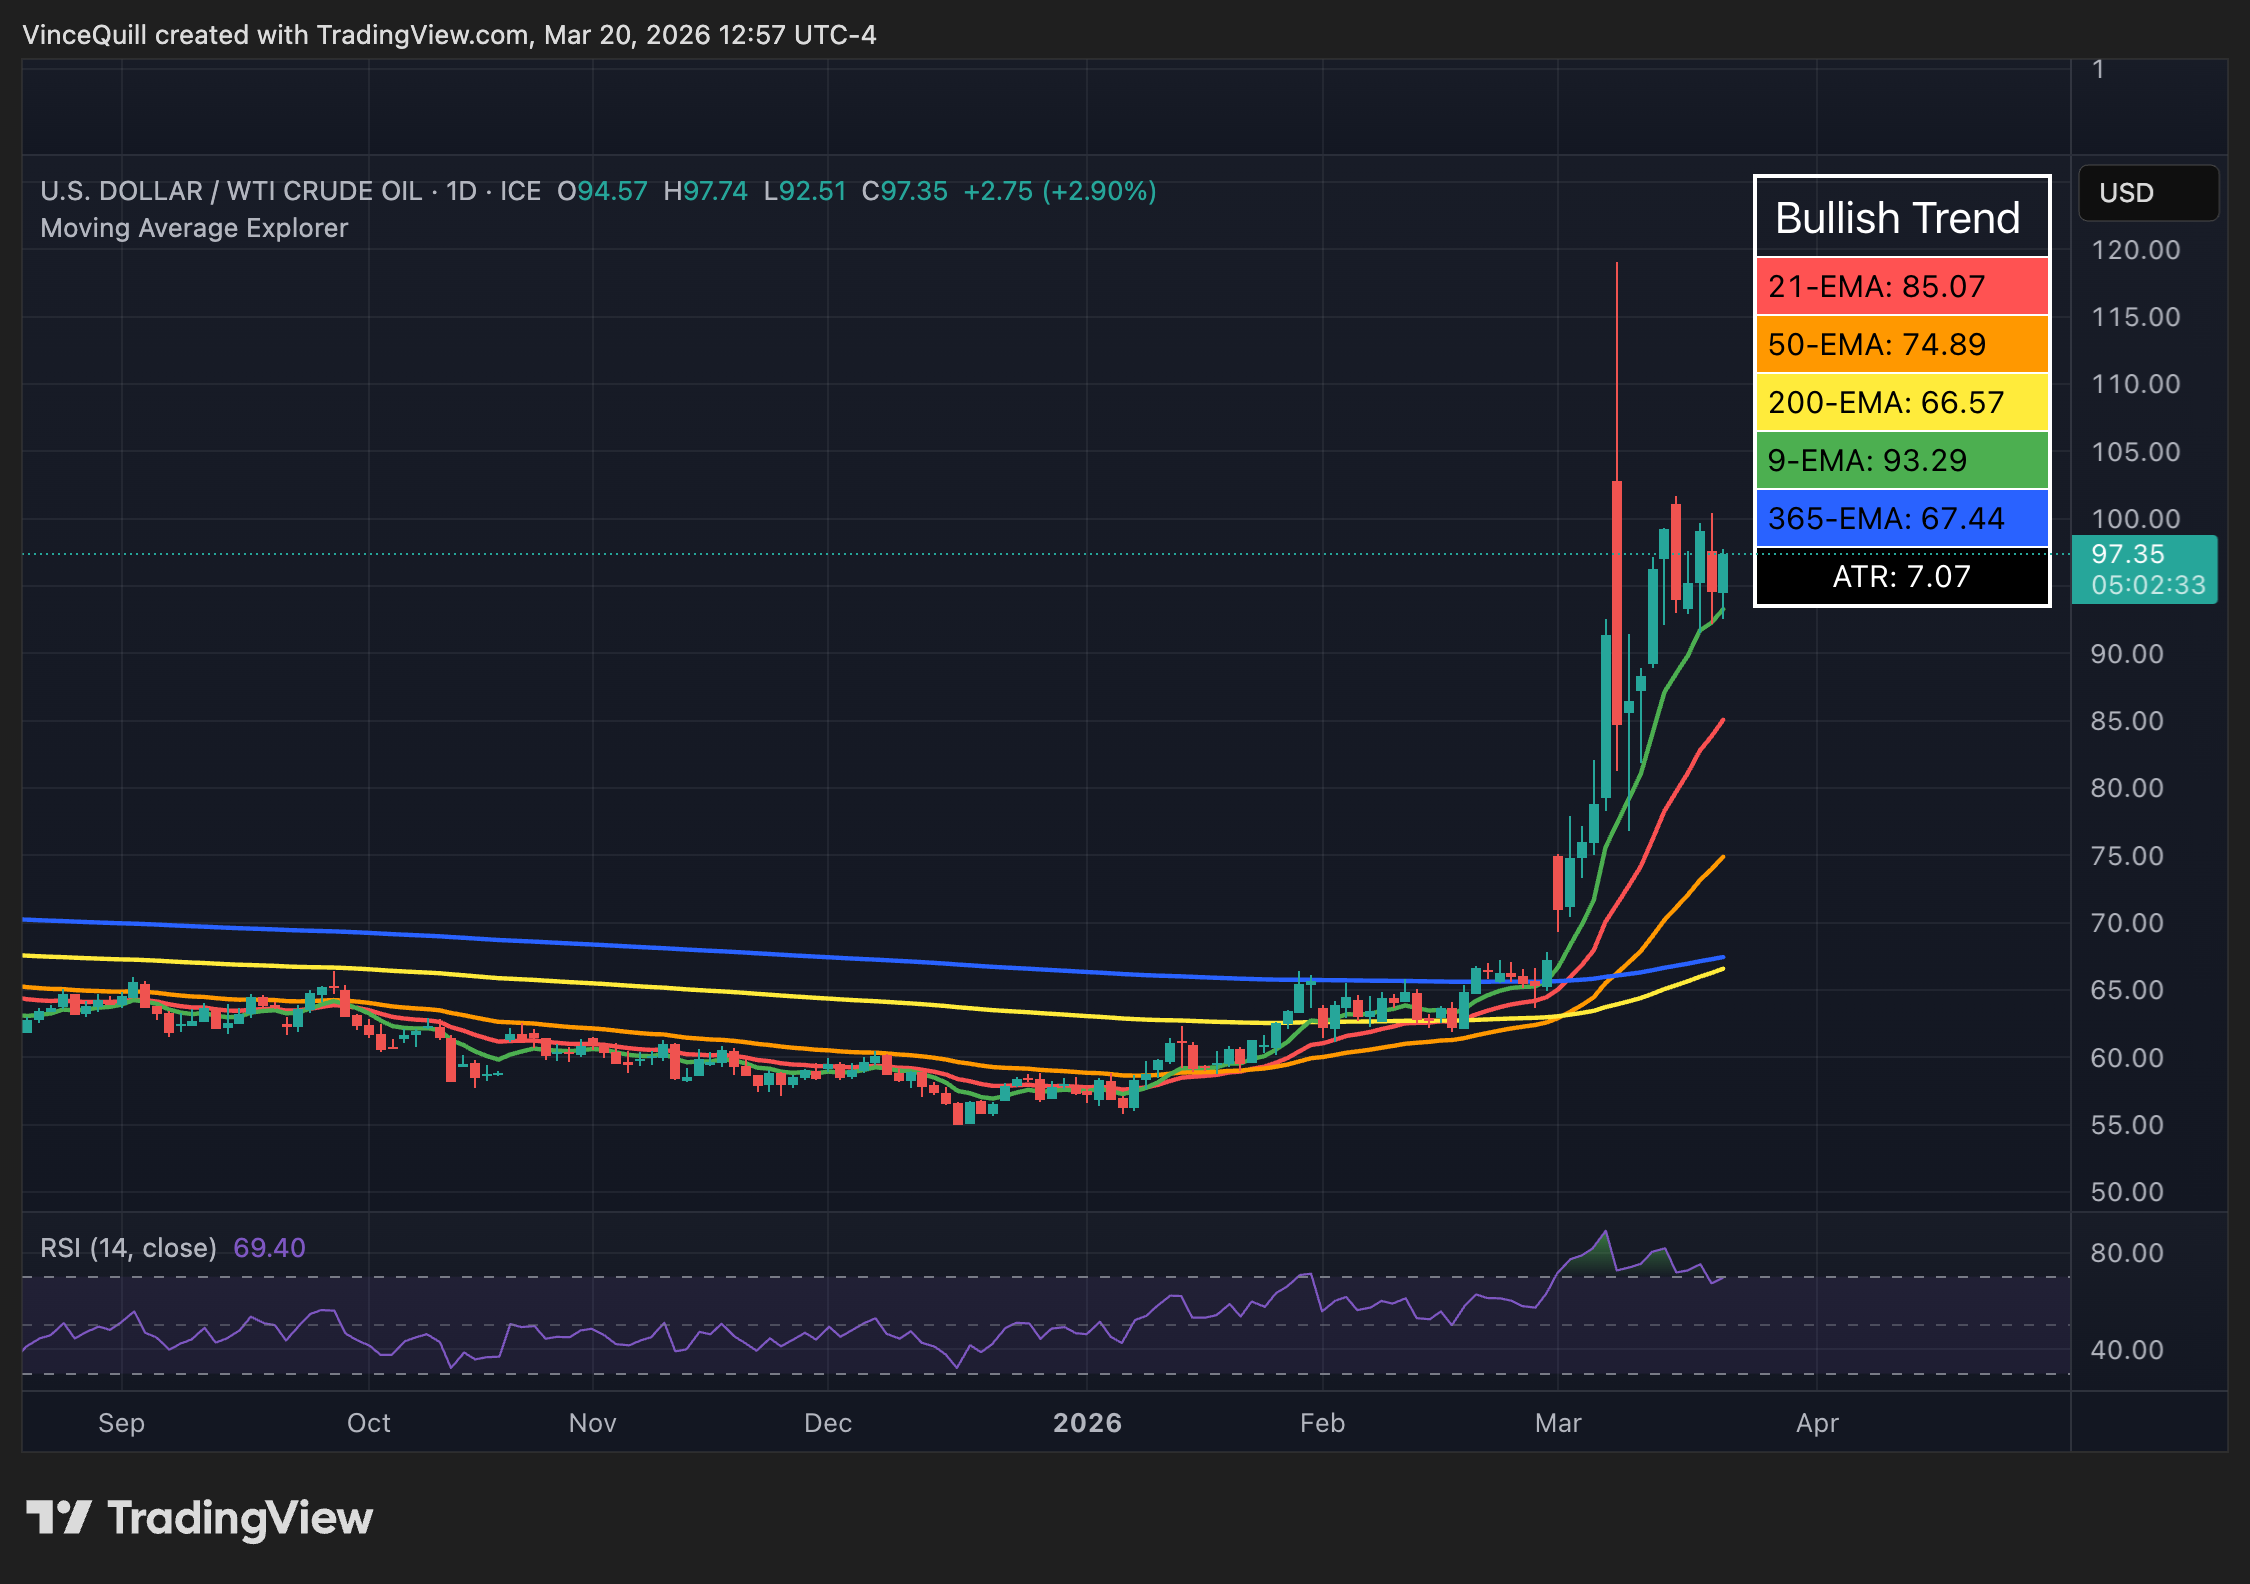 The price of West Texas Intermediate (WTI) crude has spiked since the start of the conflict, briefly surging to nearly $120 per barrel. Source:
TradingView
The price of West Texas Intermediate (WTI) crude has spiked since the start of the conflict, briefly surging to nearly $120 per barrel. Source:
TradingView
This environment could lead to stagflation, an economic scenario where inflation rises, while economic growth and employment fall, a “dreaded” situation, Puckrin said. He added:
“If oil stays above $100 throughout Q2 and into Q3, stagflation becomes a real problem for the Fed. In the 1970s, the S&P 500 went essentially nowhere in real terms for an entire decade once stagflation took hold.”
Markets might have a “rude awakening” to the war in the Middle East, Puckrin said, stressing that the longer the Strait of Hormuz, a waterway that 20% of the global oil supply passes through, remains closed, the economic effects will worsen.
“Even if the Strait of Hormuz were to open today, the disruption to the Gulf’s oil-producing infrastructure will take months to rebuild,” he said.
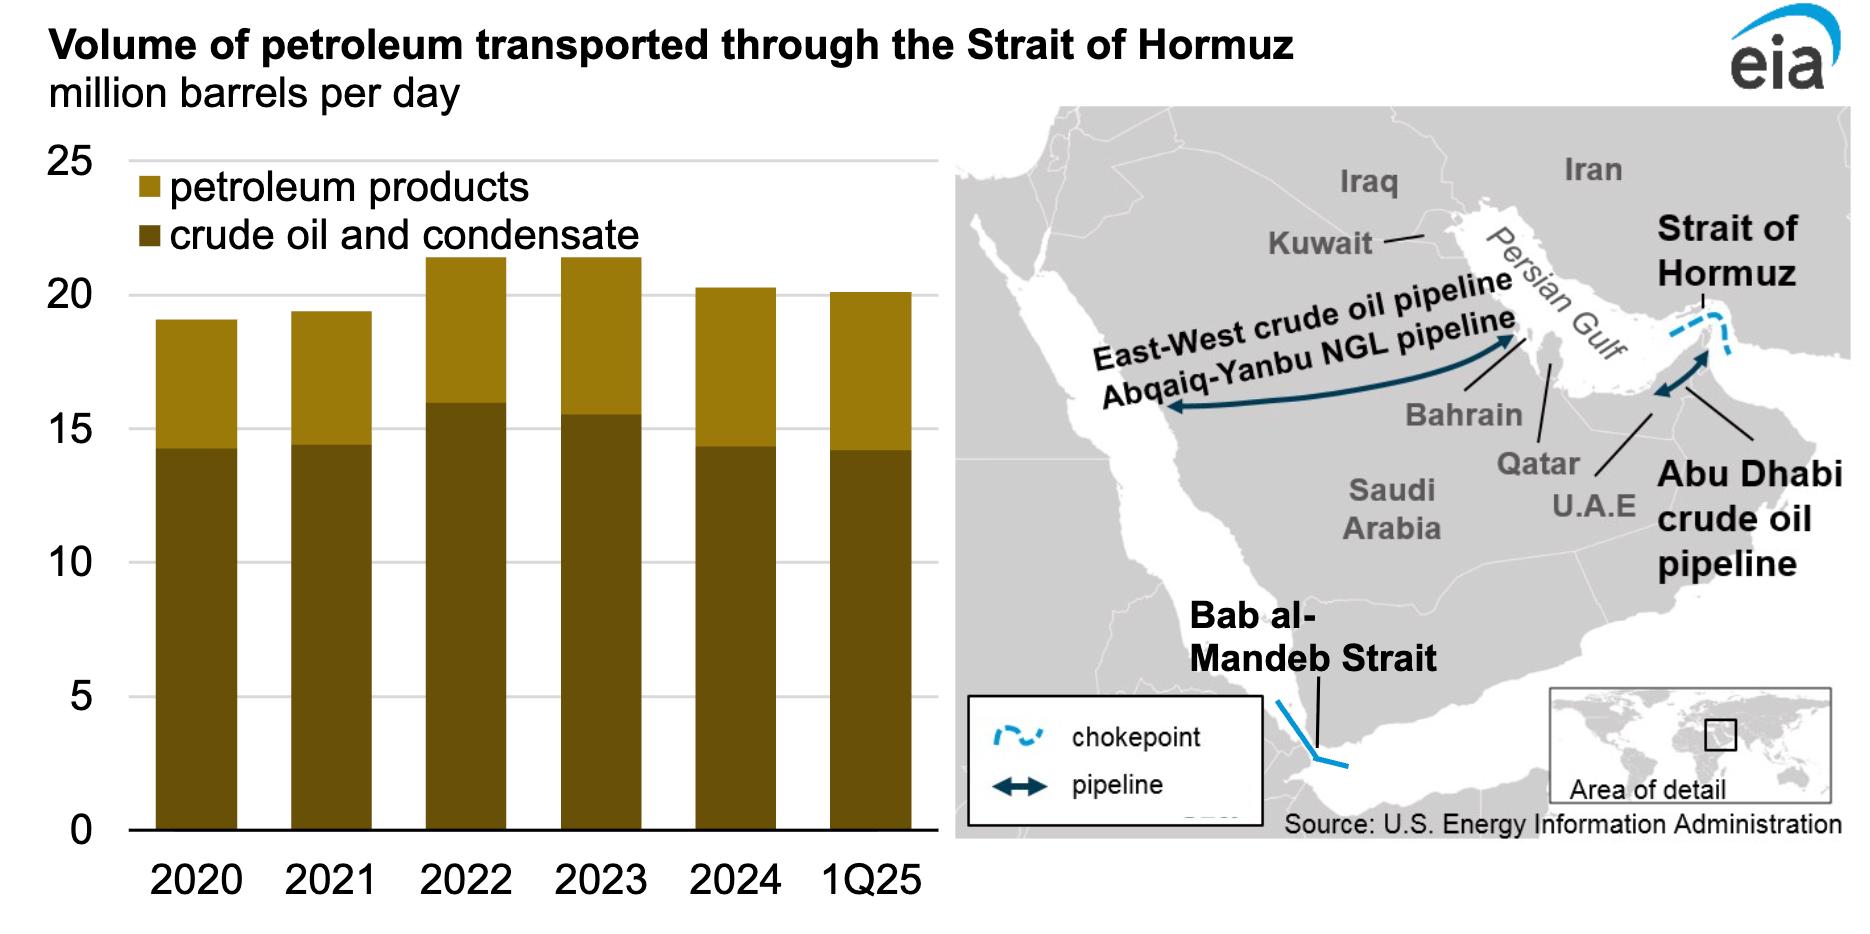 Annual volume of petroleum transported through the Strait of Hormuz between 2020 and Q1 of 2025. Source:
US Energy Information Administration
Annual volume of petroleum transported through the Strait of Hormuz between 2020 and Q1 of 2025. Source:
US Energy Information Administration
Energy is a critical input to all economic activity, and a rise in energy prices typically raises the price of all other goods and services.
Elevated inflation means interest rate cuts, which are stimulative to risk assets like crypto, will not materialize, and the Federal Reserve may raise rates to combat inflation, quashing any hopes of easing liquidity conditions to spur a crypto market rally.
Related: Bitcoin whales shift $100M+ as oil spike rattles markets
Federal Reserve chairman says Middle East war clouds the central bank’s forecasts
The Federal Open Market Committee (FOMC), the group that determines interest rate policy in the United States, held interest rates steady in March, leaving the Federal Funds rate between 3.5% and 3.75%.
Rate cut odds have all but vanished for the upcoming April FOMC meeting. Meanwhile, there’s a small but growing probability — aorund 12% — that the FOMC will raise rates next month, according to the Chicago Mercantile Exchange’s (CME) FedWatch tool.
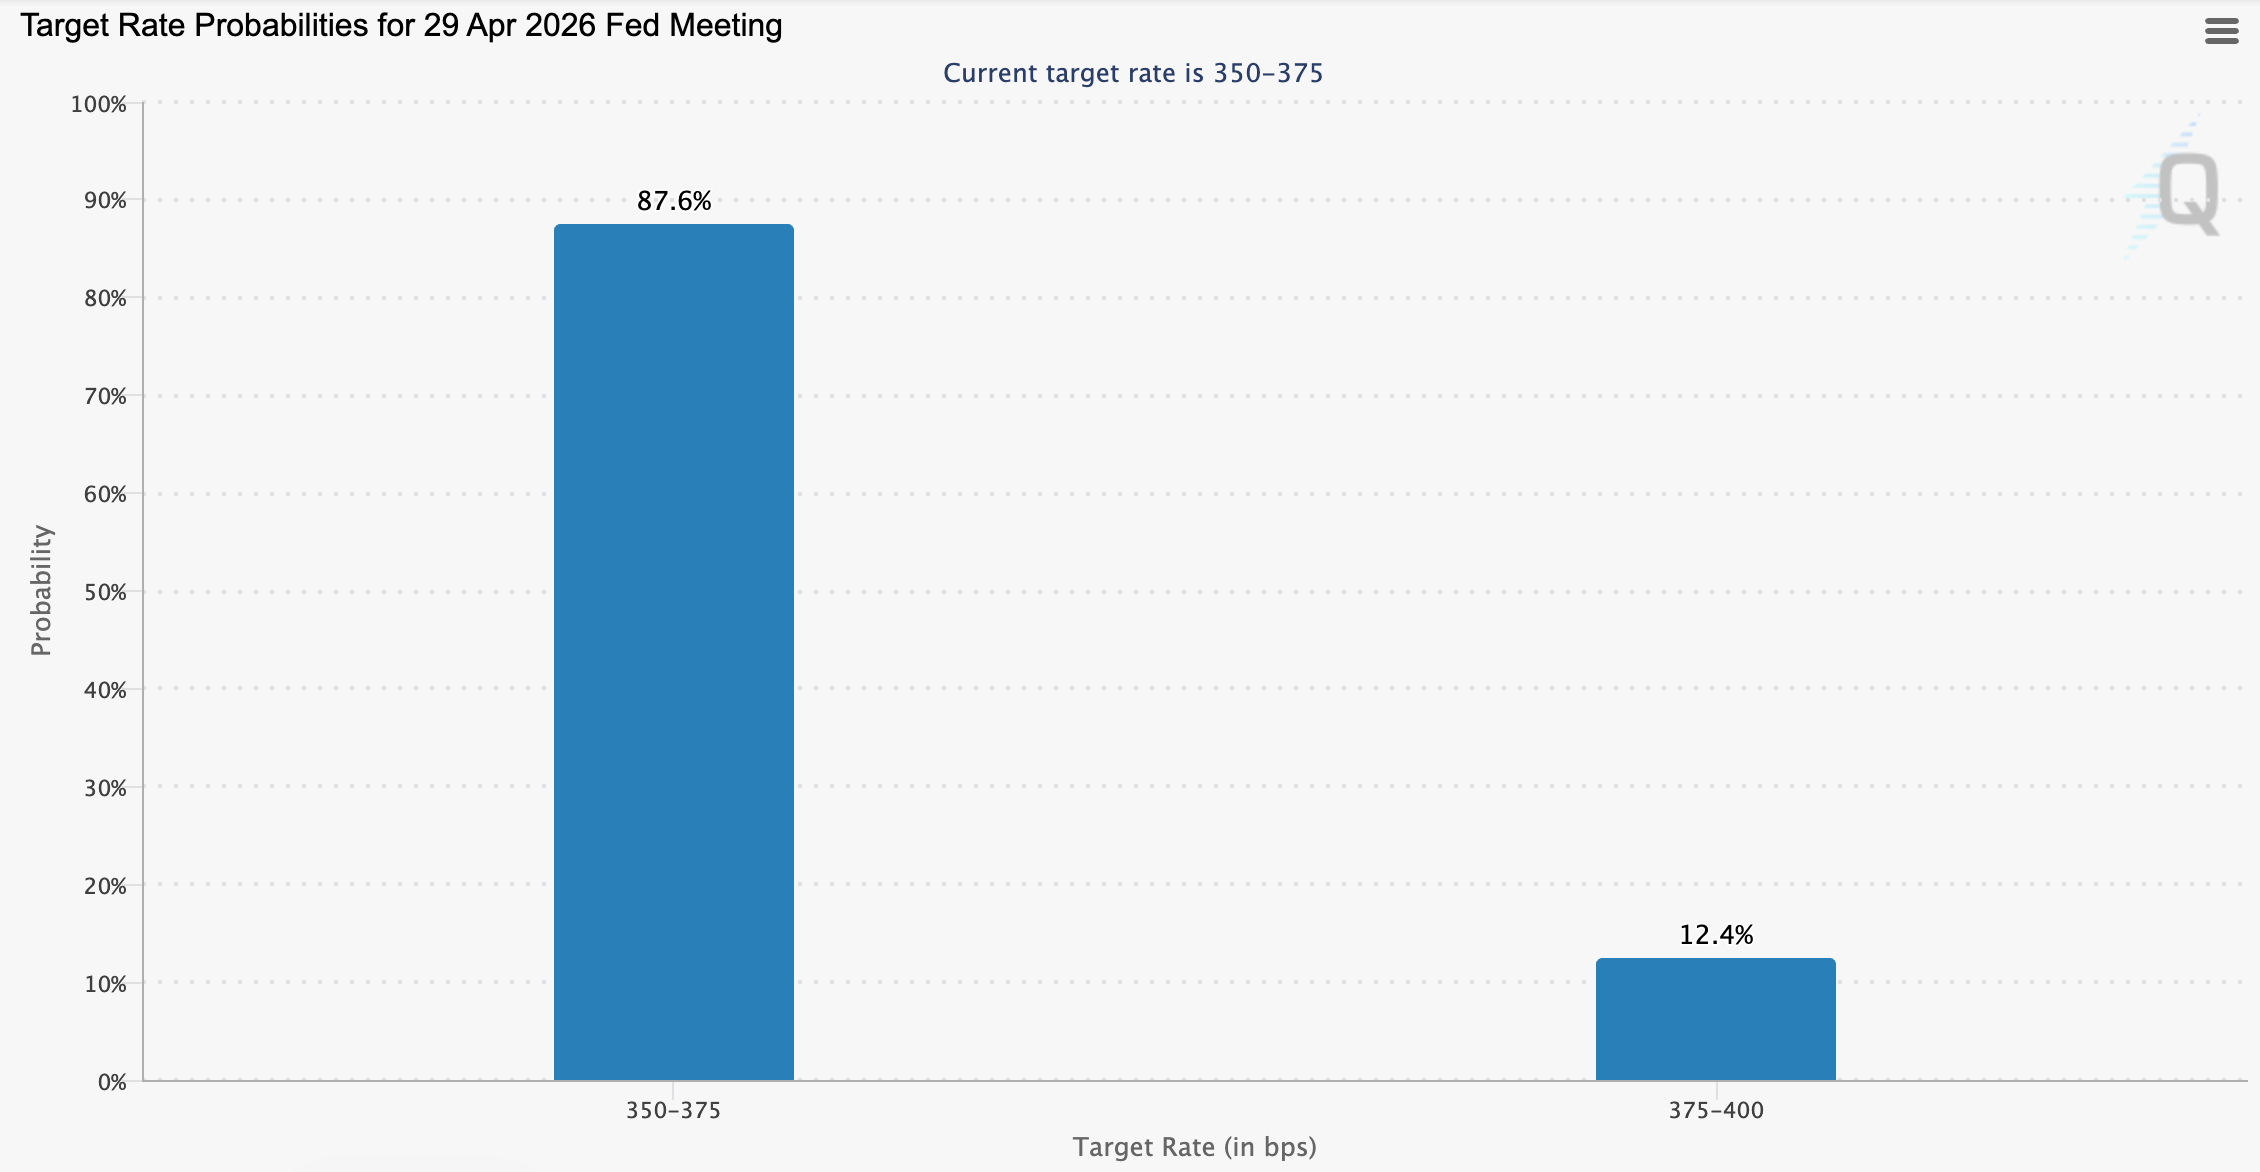 Target rate probabilities for the April 2026 FOMC meeting. Source:
CME Group
Target rate probabilities for the April 2026 FOMC meeting. Source:
CME Group
“The implications of events in the Middle East for the US economy are uncertain in the near term. Higher energy prices will push up overall inflation,” Federal Reserve Chairman Jerome Powell said at a press conference on Wednesday.
However, Powell clarified that it is still “too soon” to accurately gauge the scope and severity of the potential economic effects from the war and the disruption to the global energy infrastructure.
Magazine: Bitcoin is ‘funny internet money’ during a crisis: Tezos co-founder
Disclaimer: The content of this article solely reflects the author's opinion and does not represent the platform in any capacity. This article is not intended to serve as a reference for making investment decisions.
You may also like
NEWMARK GROUP INC <NMRK.O>: KBW CUTS TARGET PRICE TO $16 FROM $17.50
NEWMARK GROUP INC : KBW CUTS TARGET PRICE TO $16 FROM $17.50
VALERO ENERGY CORP <VLO.N>: JEFFERIES CUTS TARGET PRICE TO $394 FROM $401
VALERO ENERGY CORP : JEFFERIES CUTS TARGET PRICE TO $394 FROM $401
Gold prices rise Rs 1,500/10g; silver up Rs 3,100/kg ahead of US economic data, softer yields. Buy, sell or hold?
The Shopify Stock Rally Isn't Done: Chart of the Week -- Barrons.com
By Doug Busch Shopify is no longer a pandemic-era growth story that simply failed to slow down. It is compounding at a pace few software platforms its size still manage. In the second quarter of 2026, sales on its platform rose 32%. That was the fifth straight quarter of growth exceeding 30%. Merchants are also using more of Shopify's own tools, from payments to Shop Pay, and new channels like AI shopping agents are starting to increase demand. The simple bull case is that the stock already commands a huge share of independent online commerce, and that position should become more valuable as more buying moves through its checkout. A rule of market mechanics is that the vast majority of an individual security's gain is driven by its underlying sector. Within technology, software has staged a robust recovery, joining semiconductors to power the broader sector higher. The iShares Expanded Tech-Software Sector ETF has maintained an upward trajectory since its mid-April lows, though the advance from $74 to $112 has been choppy as bulls repeatedly stepped in to defend when necessary. Breadth across large-cap software has expanded significantly, with 24 constituents surging over 20% over the past three months. During that same three-month window, Shopify generated outstanding relative strength, advancing 36%, more than doubling the IGV's 17% gain over the same period. Expect the stock's outperformance to persist as software momentum broadens. Let's examine the daily and monthly charts to outline the technical drivers behind this thesis. Looking at the daily chart, the ratio chart against the IGV shows persistent outperformance extending back to mid-May. The stock is riding an eight-session winning streak, during which price action cleared a double-bottom-with-handle pivot at $151.39. Within this broader base, the stock recorded a bullish golden cross in late August and successfully filled its Sept. 10 price gap, tracing back to its Aug. 4 session, the day before a powerful earnings reaction sent the stock surging 17% hi
Crypto prices
More


