
What happens to Bitcoin if oil price hits $180 per barrel?

Bitcoin (BTC) has outperformed US equities and gold since the US and Israel’s attack on Iran on Feb. 28, underscoring its strength amid one of the year’s biggest geopolitical shocks.
However, BTC’s rally may face a serious challenge if oil prices spike toward $180 per barrel, a scenario some Saudi Arabian officials now see as plausible if Middle East supply disruptions persist beyond April.
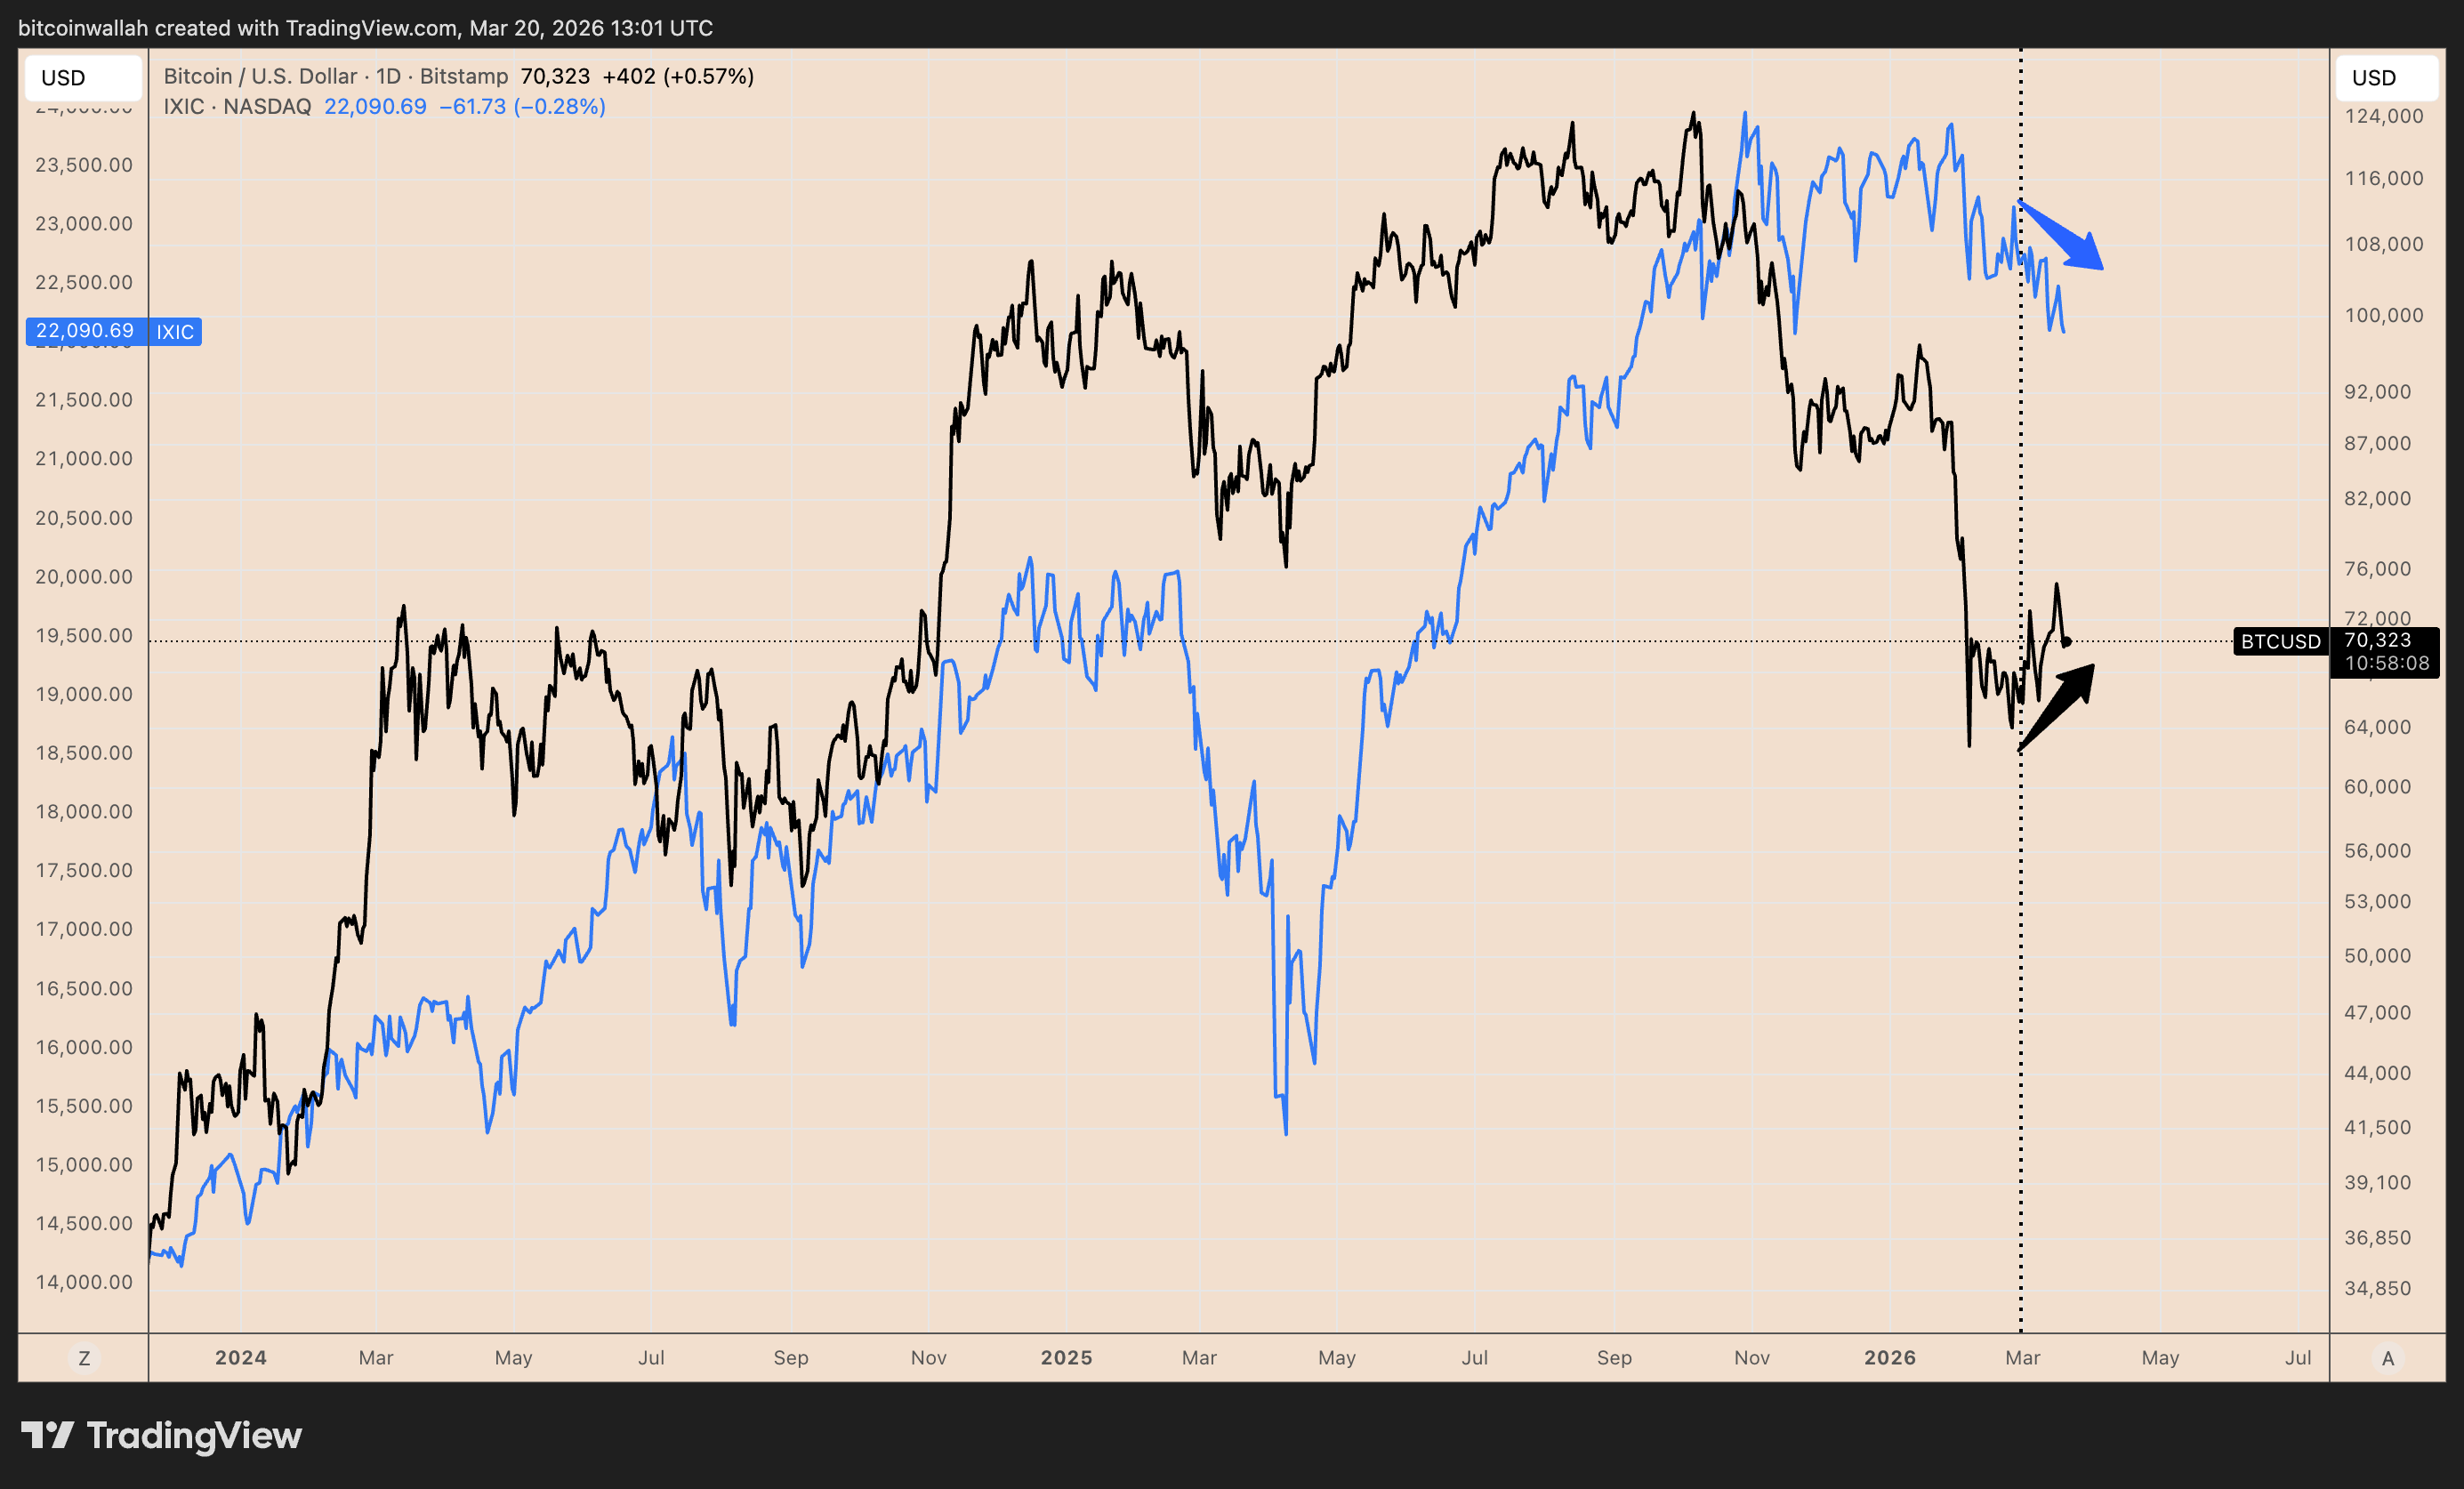 BTC/USD (black) vs. Nasdaq (blue) daily performance chart. Source: TradingView
Key takeaways:
US headline inflation may rise to 5% if oil supply shock persists, lowering rate cut odds in 2026.
Such macro headwinds risk sending the Bitcoin price to $51,000 in the coming months.
Oil boom may double US inflation and hurt Bitcoin
As of Friday, Brent crude was trading for around $105 per barrel, up roughly 50% since the US and Israel-Iran war started.
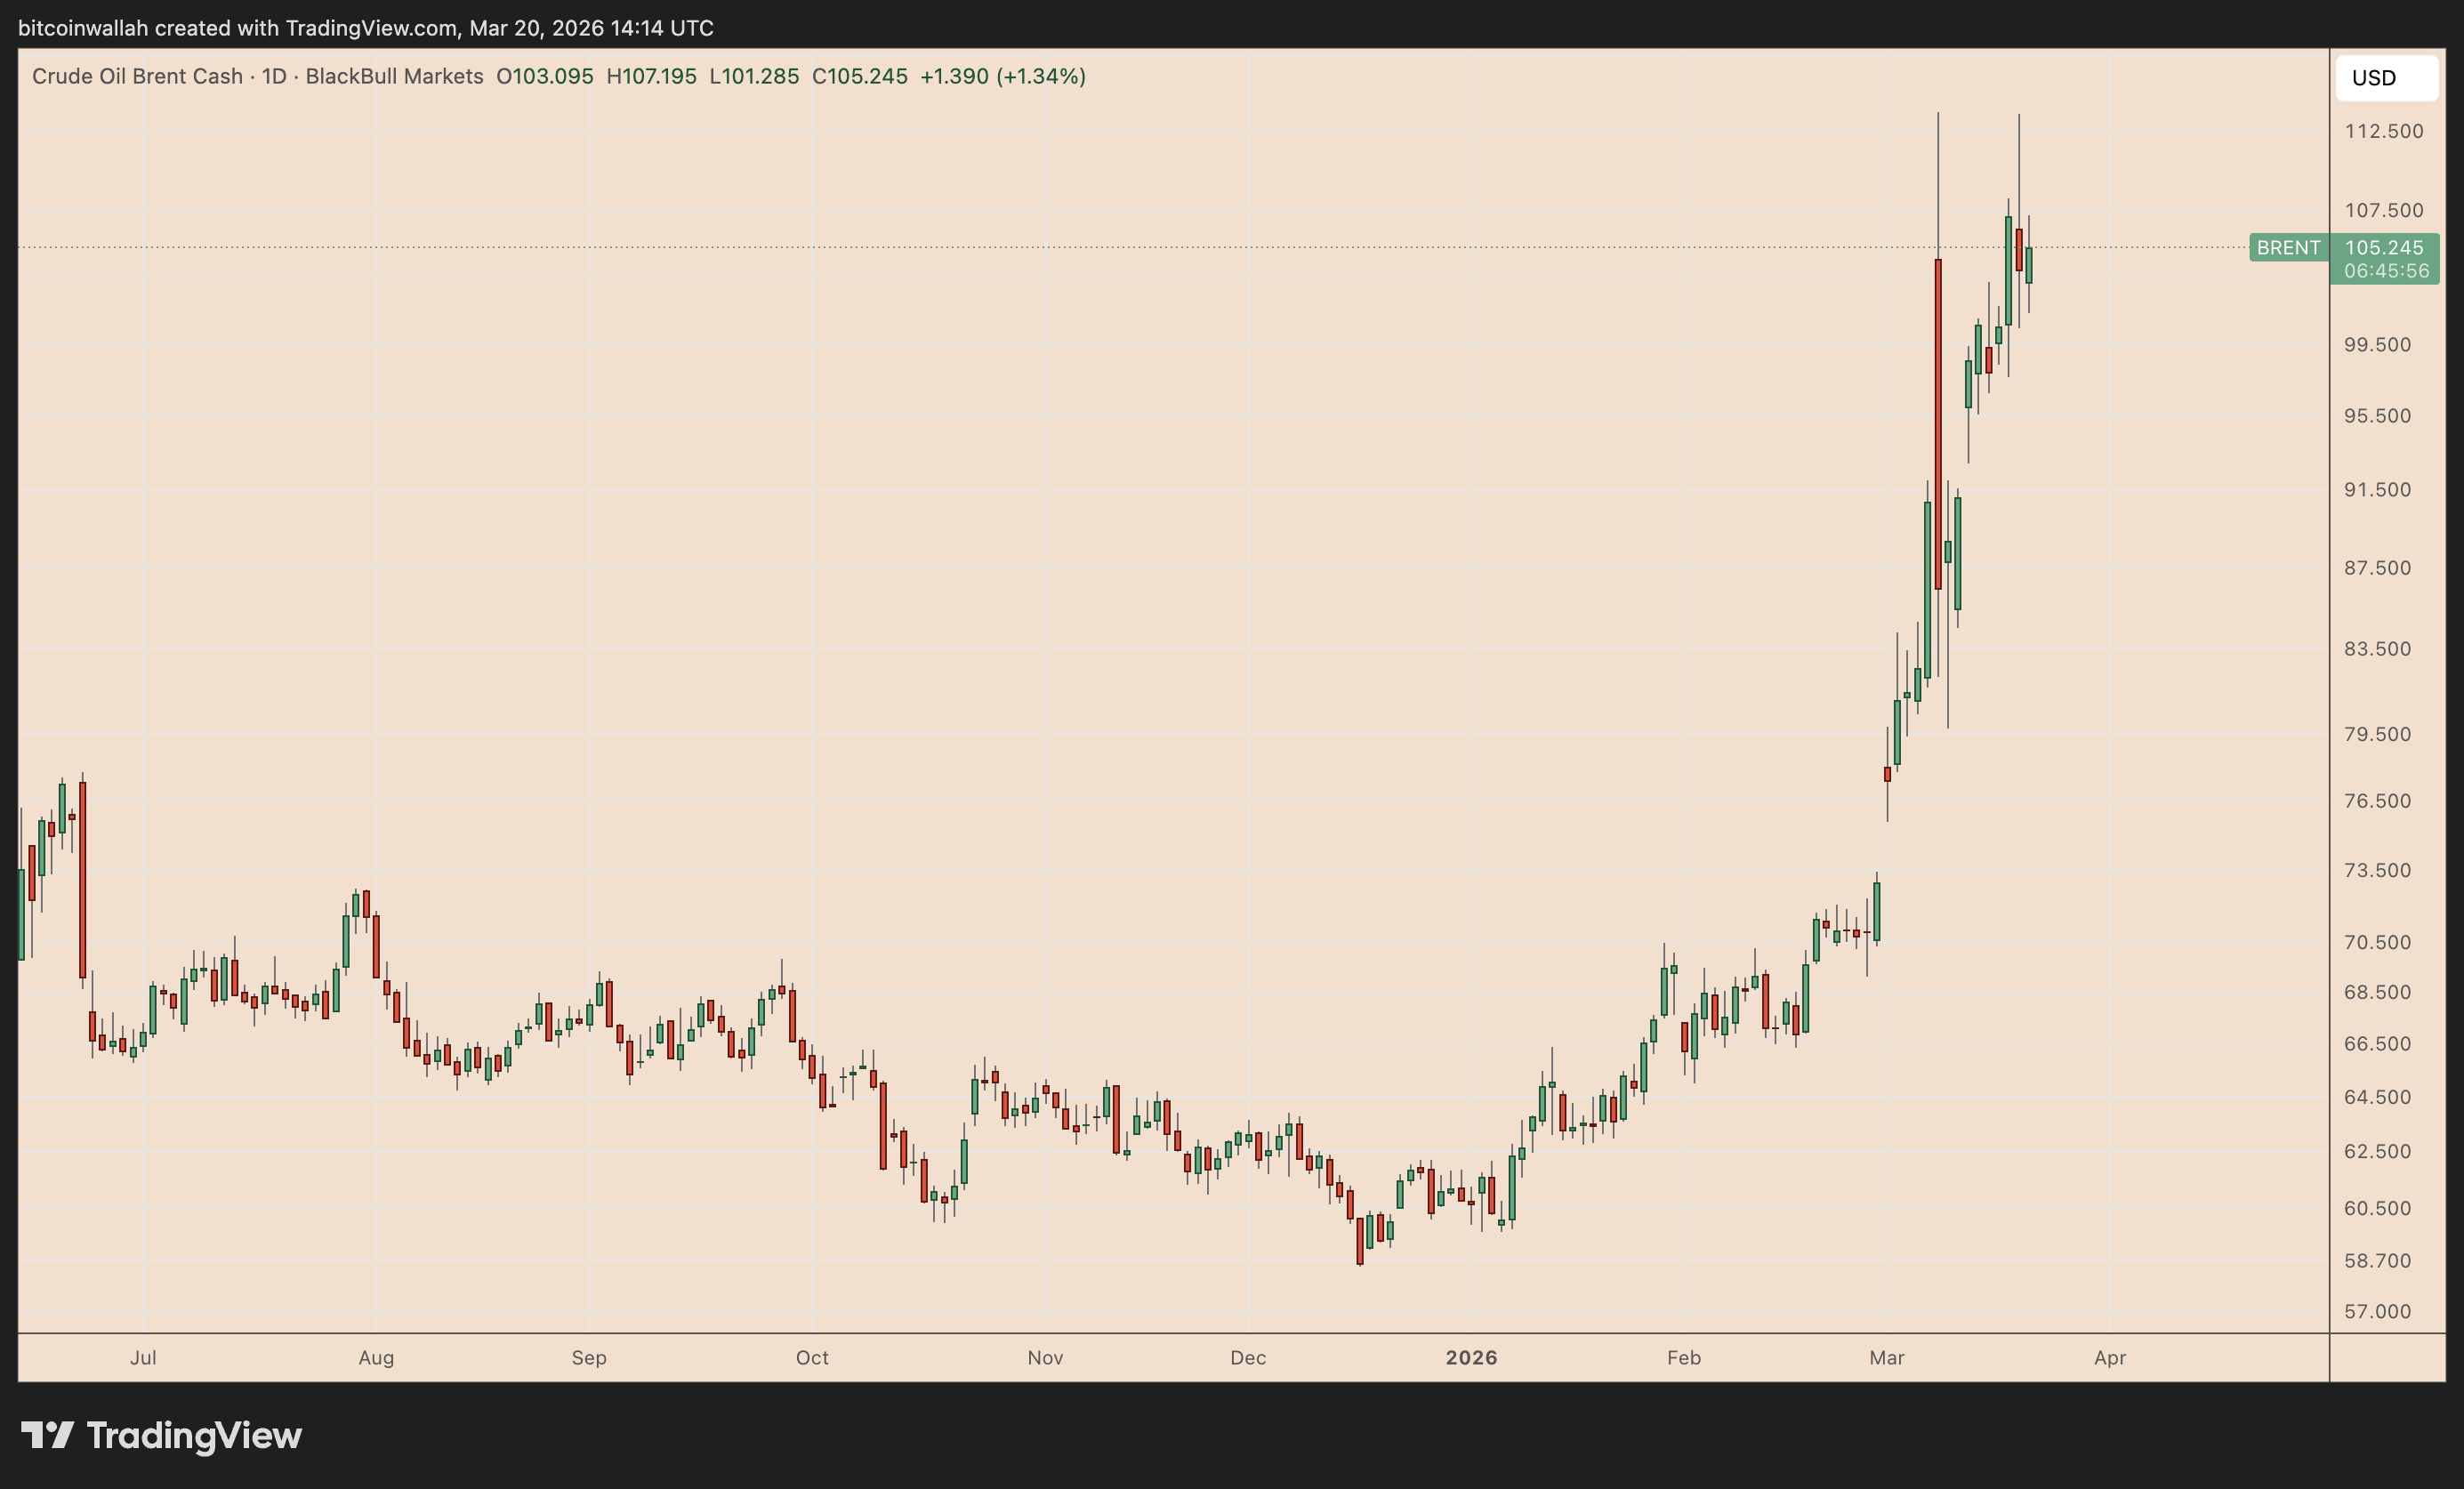 Brent Crude daily performance chart. Source: TradingView
Oil transits through Iran’s Strait of Hormuz fell to 9.71 million barrels per day by mid-March from 25.13 million in February, according to Kpler data.
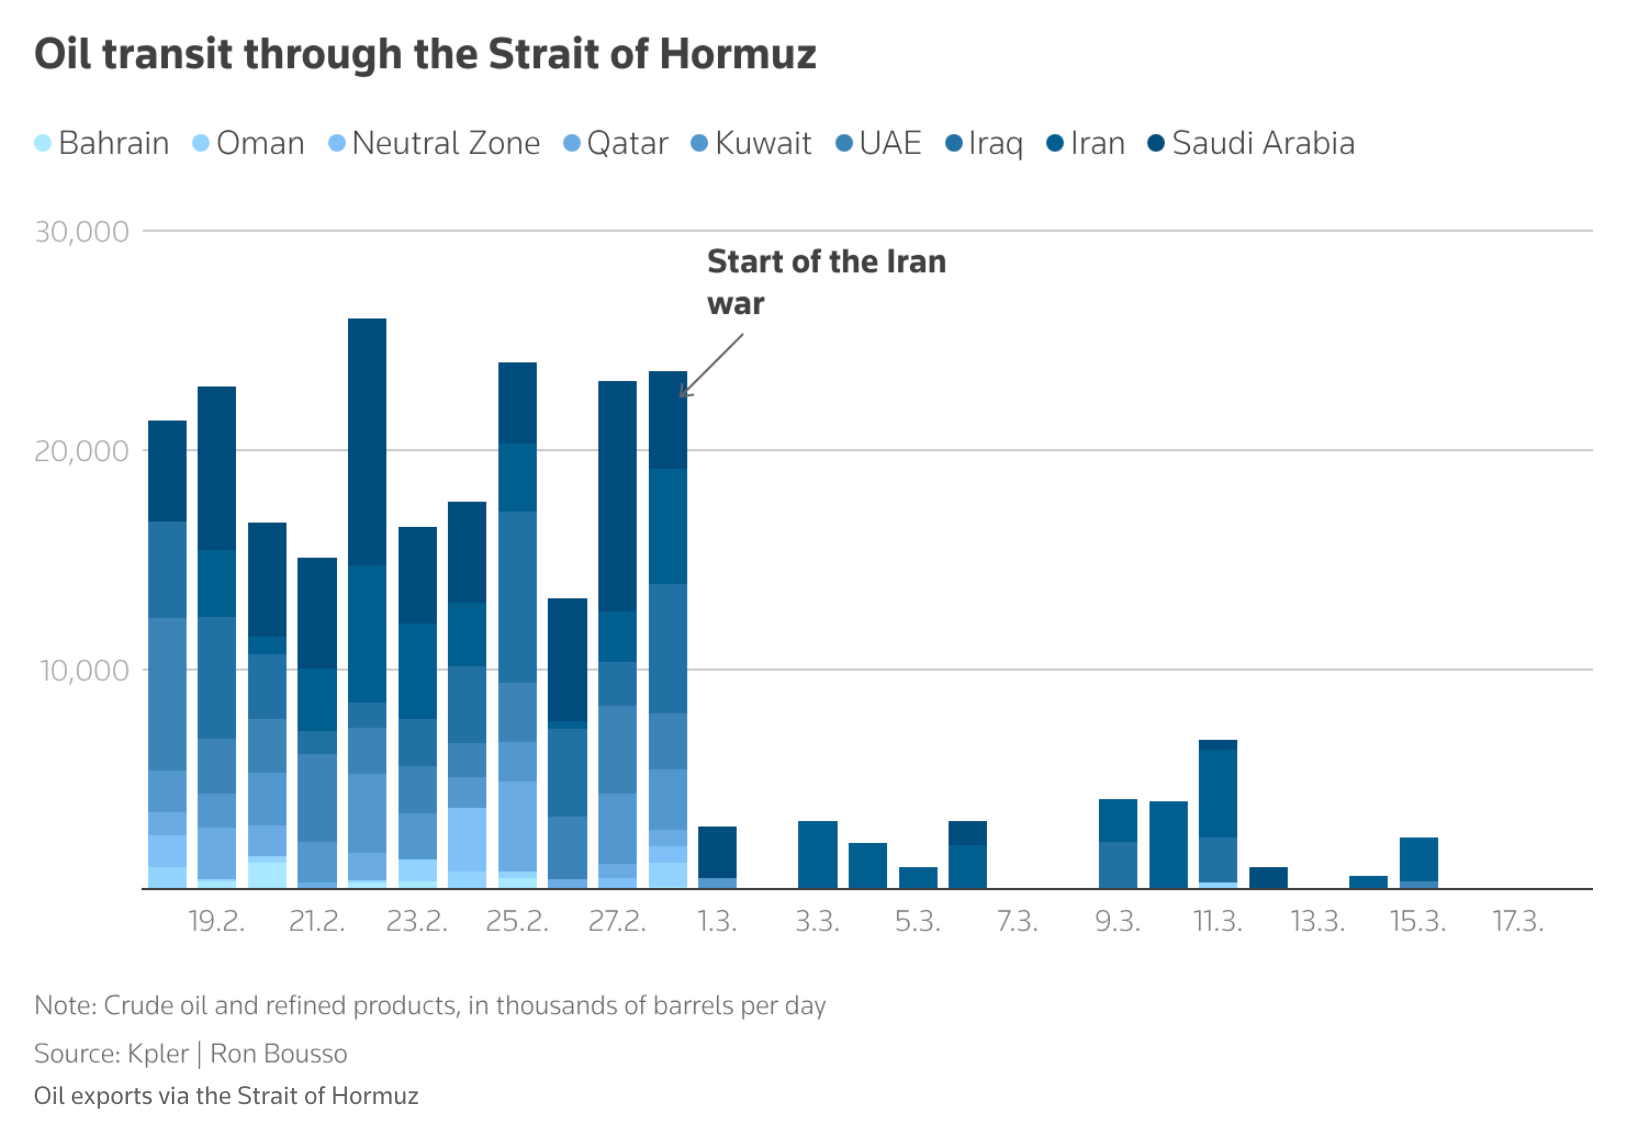 Oil transit through the Strait of Hormuz. Source: Kpler/
Vortexa, an energy data tracker, estimates a steeper drop to 7.5 million barrels per day, highlighting the scale of the Middle East supply shock and why experts anticipate oil to rise another 70%.
A 2023 US Federal Reserve study said that every 10% rise in crude price can add about 0.35–0.40 percentage points to US CPI.
By that measure, an extended oil rally could lift inflation by roughly 2.5–2.8 points, enough to push CPI well above its current 2.4% level and further above the Fed’s 2% target.
Markets are already adjusting to that risk.
Policy easing expectations have shifted more hawkish, with markets no longer pricing in a second rate cut in 2026 and the odds of the first cut now pushed further to October 2027.
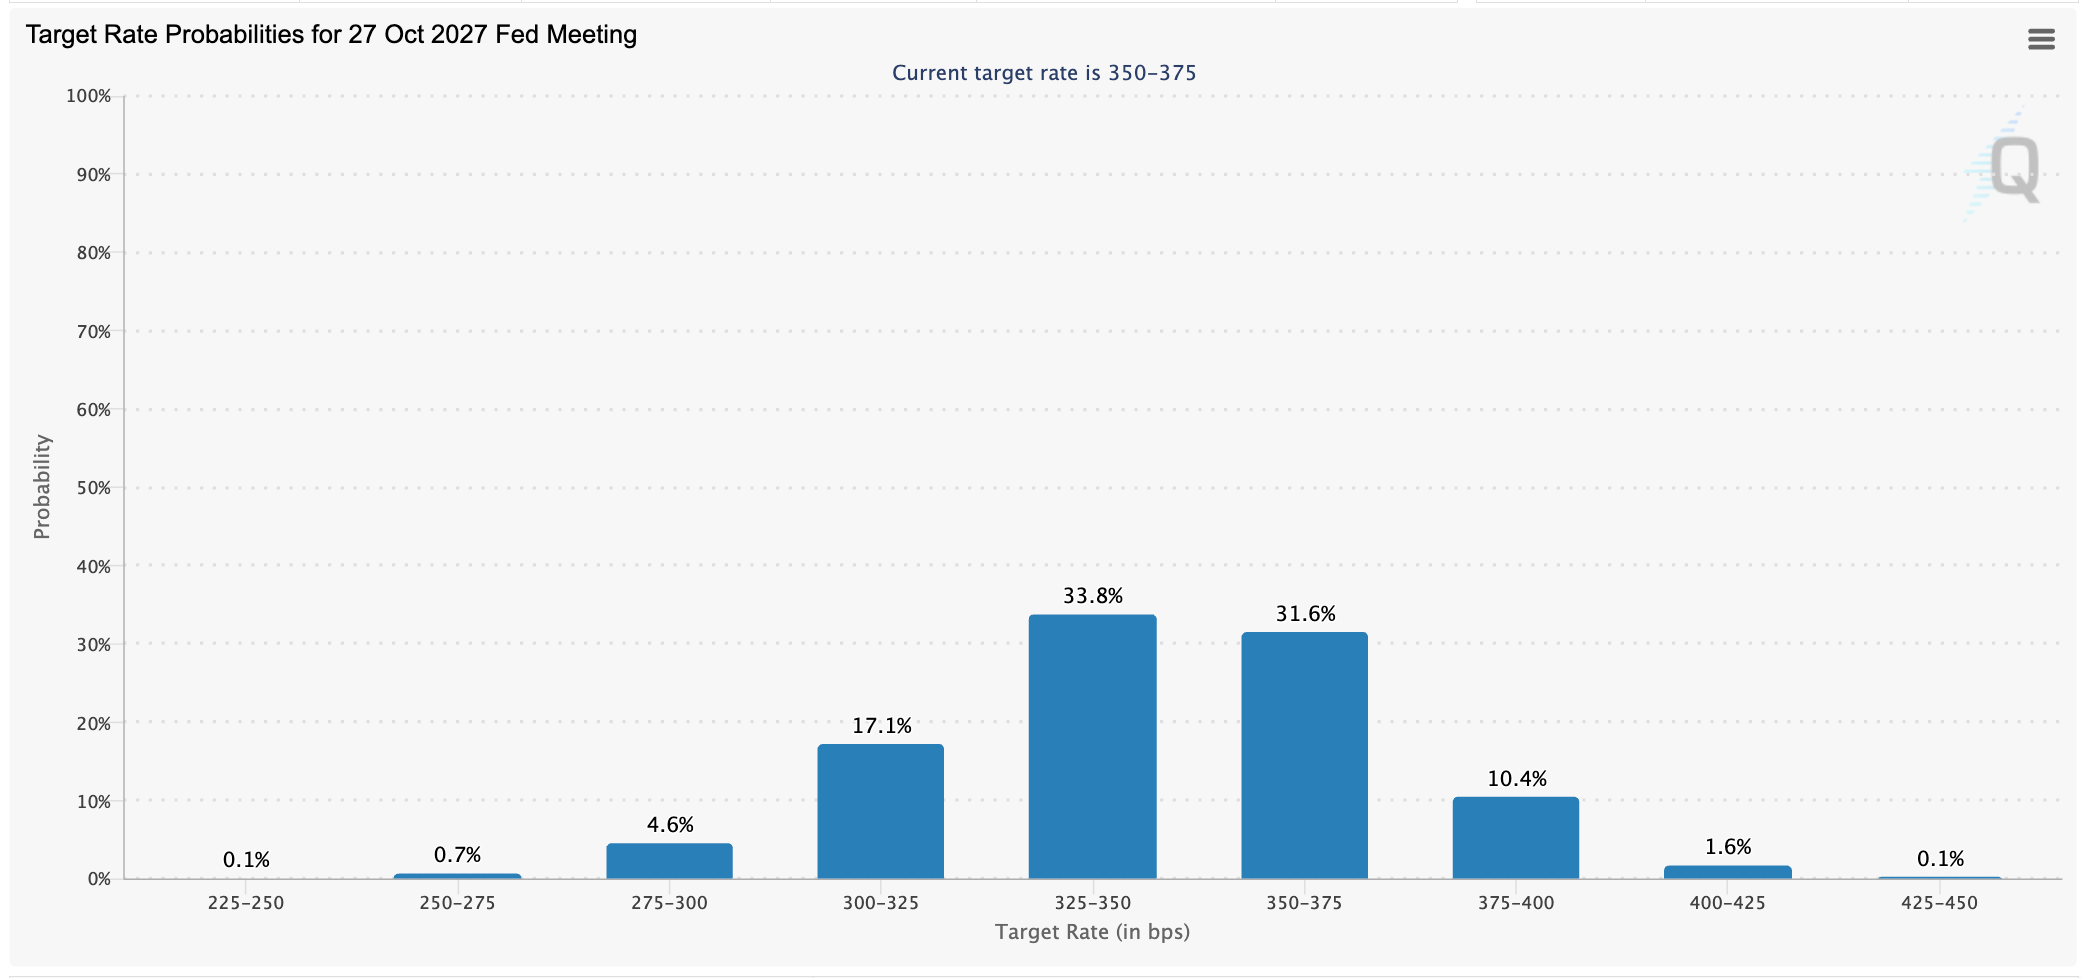 Target rate probabilities for the October 2027 meeting. Source:
Higher rates tend to keep borrowing costs high, tighten liquidity, and weaken investor appetite for risk assets such as Bitcoin and stocks.
Related: Trump ups pressure for Fed chair Powell to cut rates ‘right now’
Any signs of de-escalation in the conflict could quickly cool the oil rally.
Historically, such spikes have been short-lived, with prices normalizing over time and Bitcoin regaining strength as market fears fade.
Oil shock raises Bitcoin’s odds of hitting $51,000
The $180 oil warning appears as Bitcoin’s uptrend shows signs of fatigue.
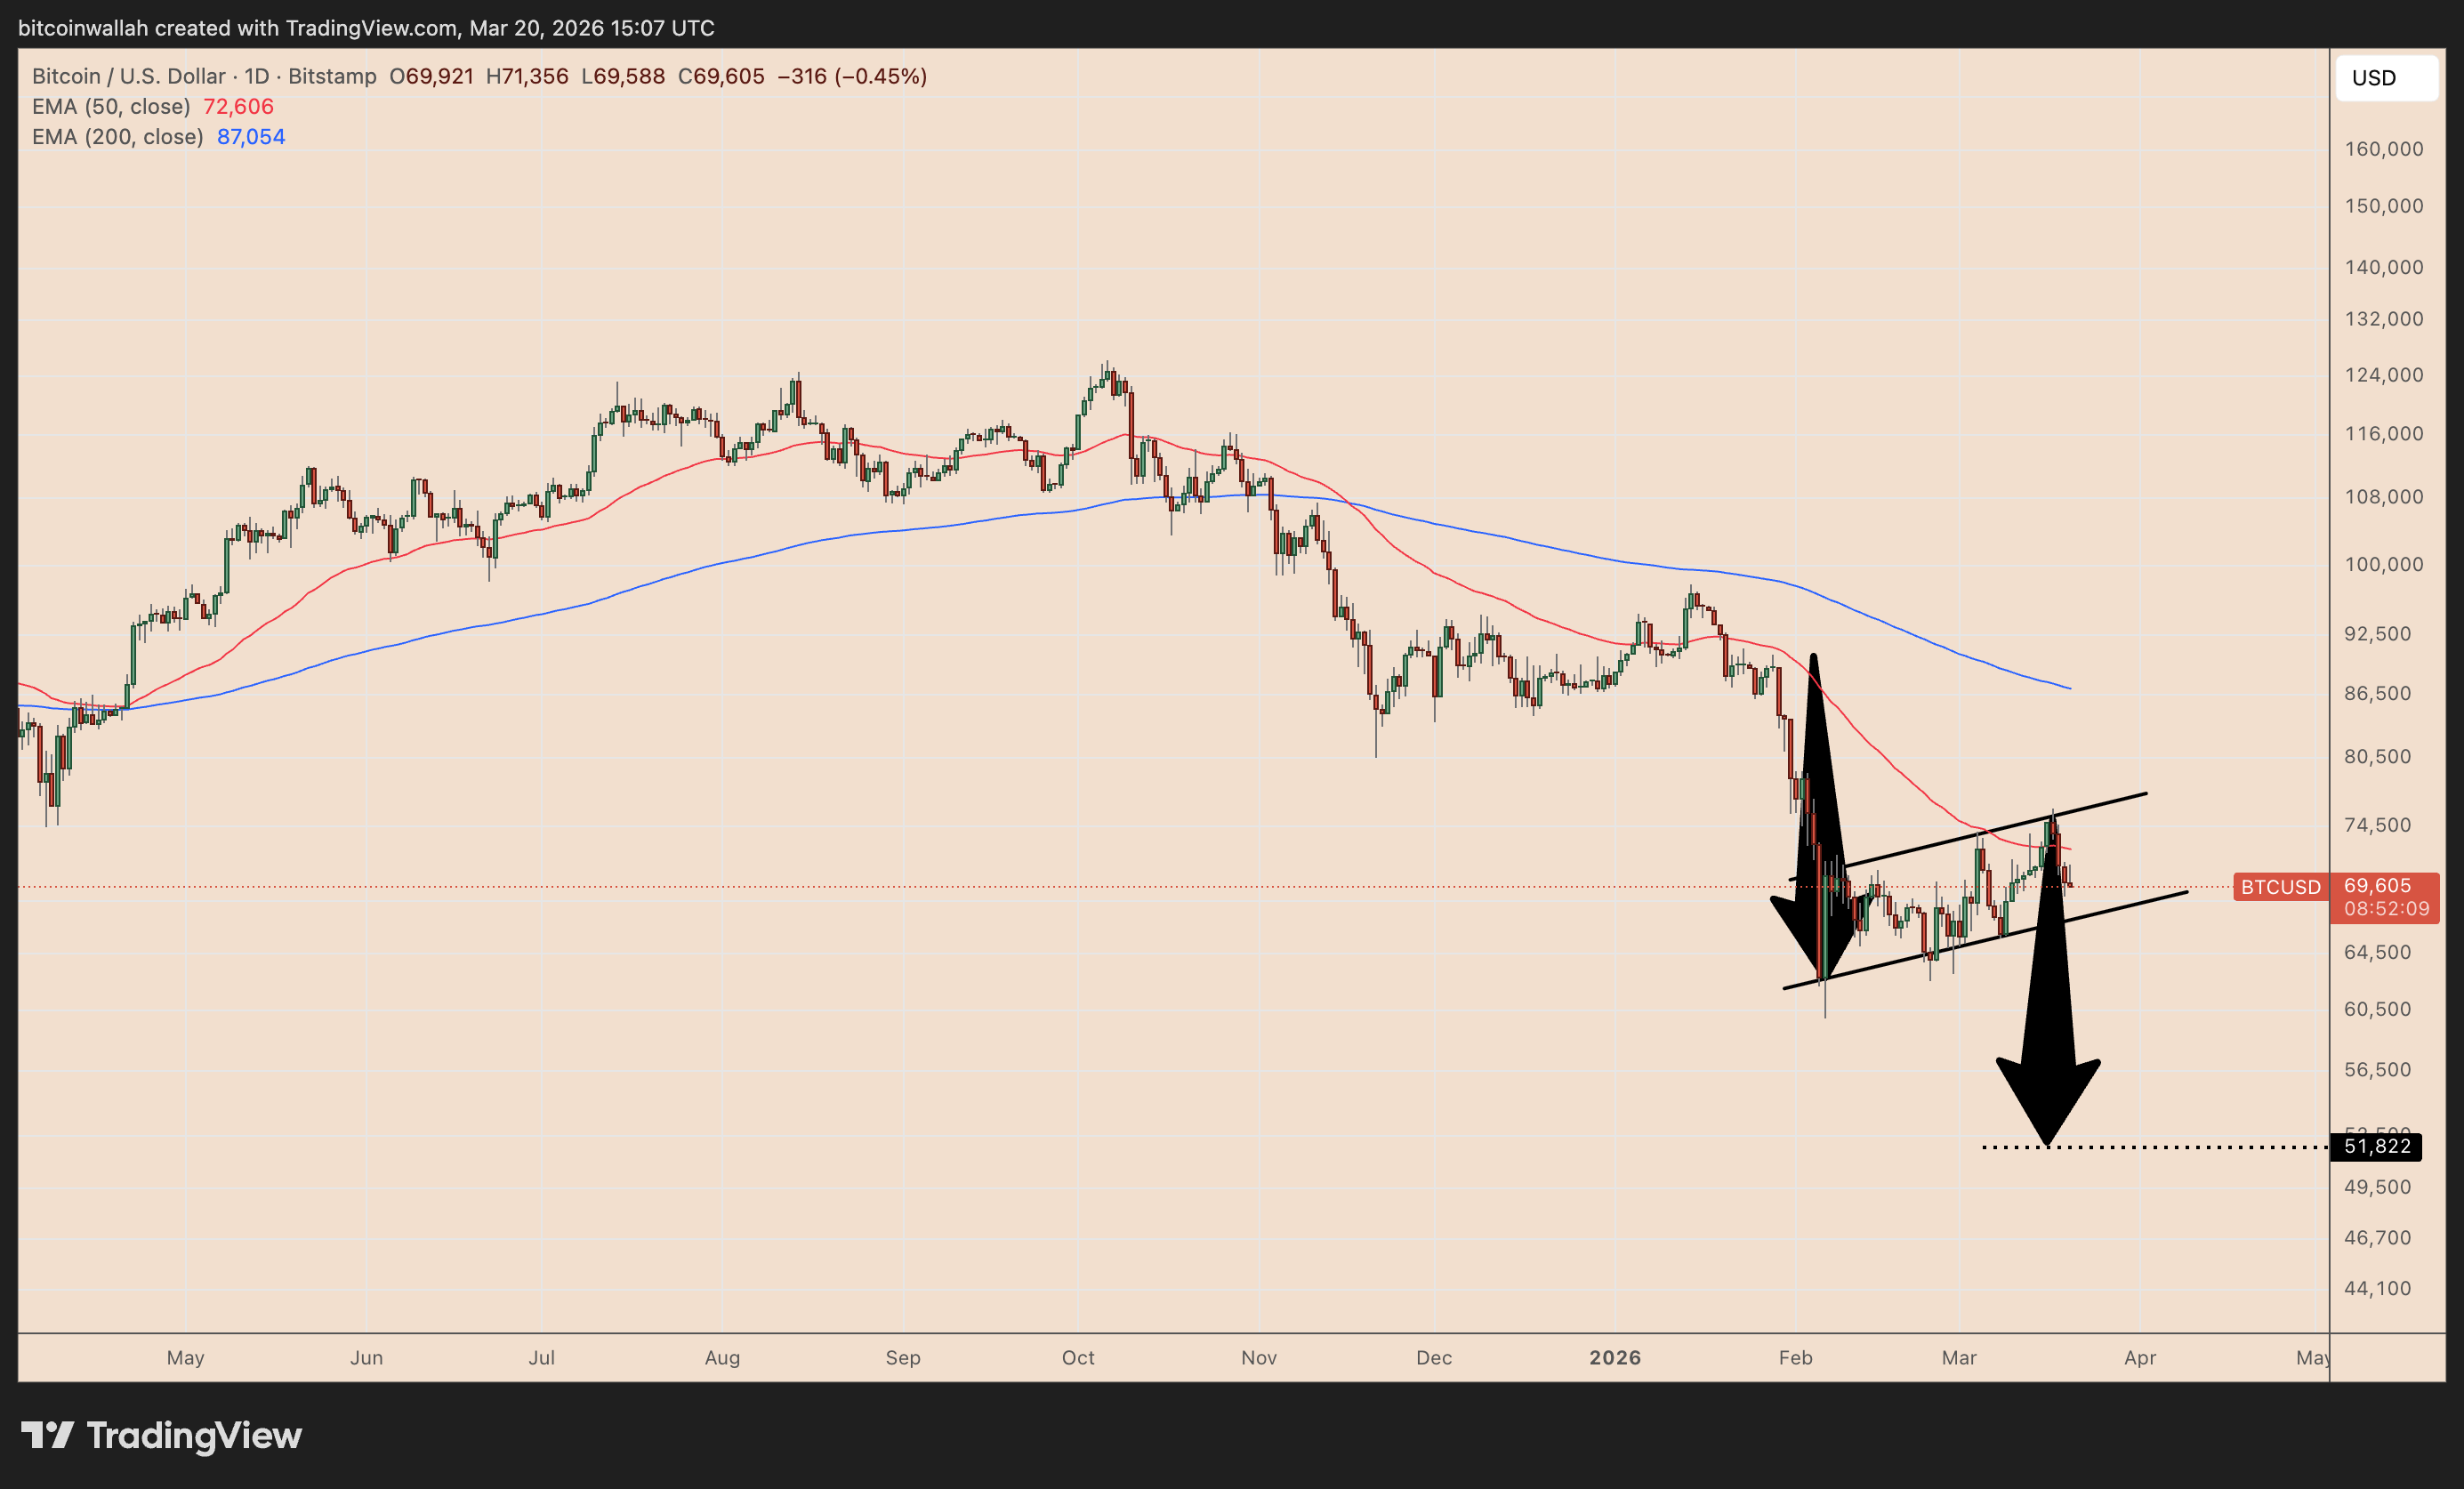
BTC’s price has dipped 9.50% from its local high of nearly $76,000, trading under $70,000 as of Thursday. Its correction has painted a bear flag pattern with a $51,000–$52,000 measured downside target.
 Edit the caption here or remove the text
Bitcoin’s pullback also coincides with a complete halt in STRC-led BTC buying by Michael Saylor’s Strategy.
The firm did not buy Bitcoin this week, after purchasing 22,337 BTC in the week ending March 15 and 17,994 BTC the week before that.
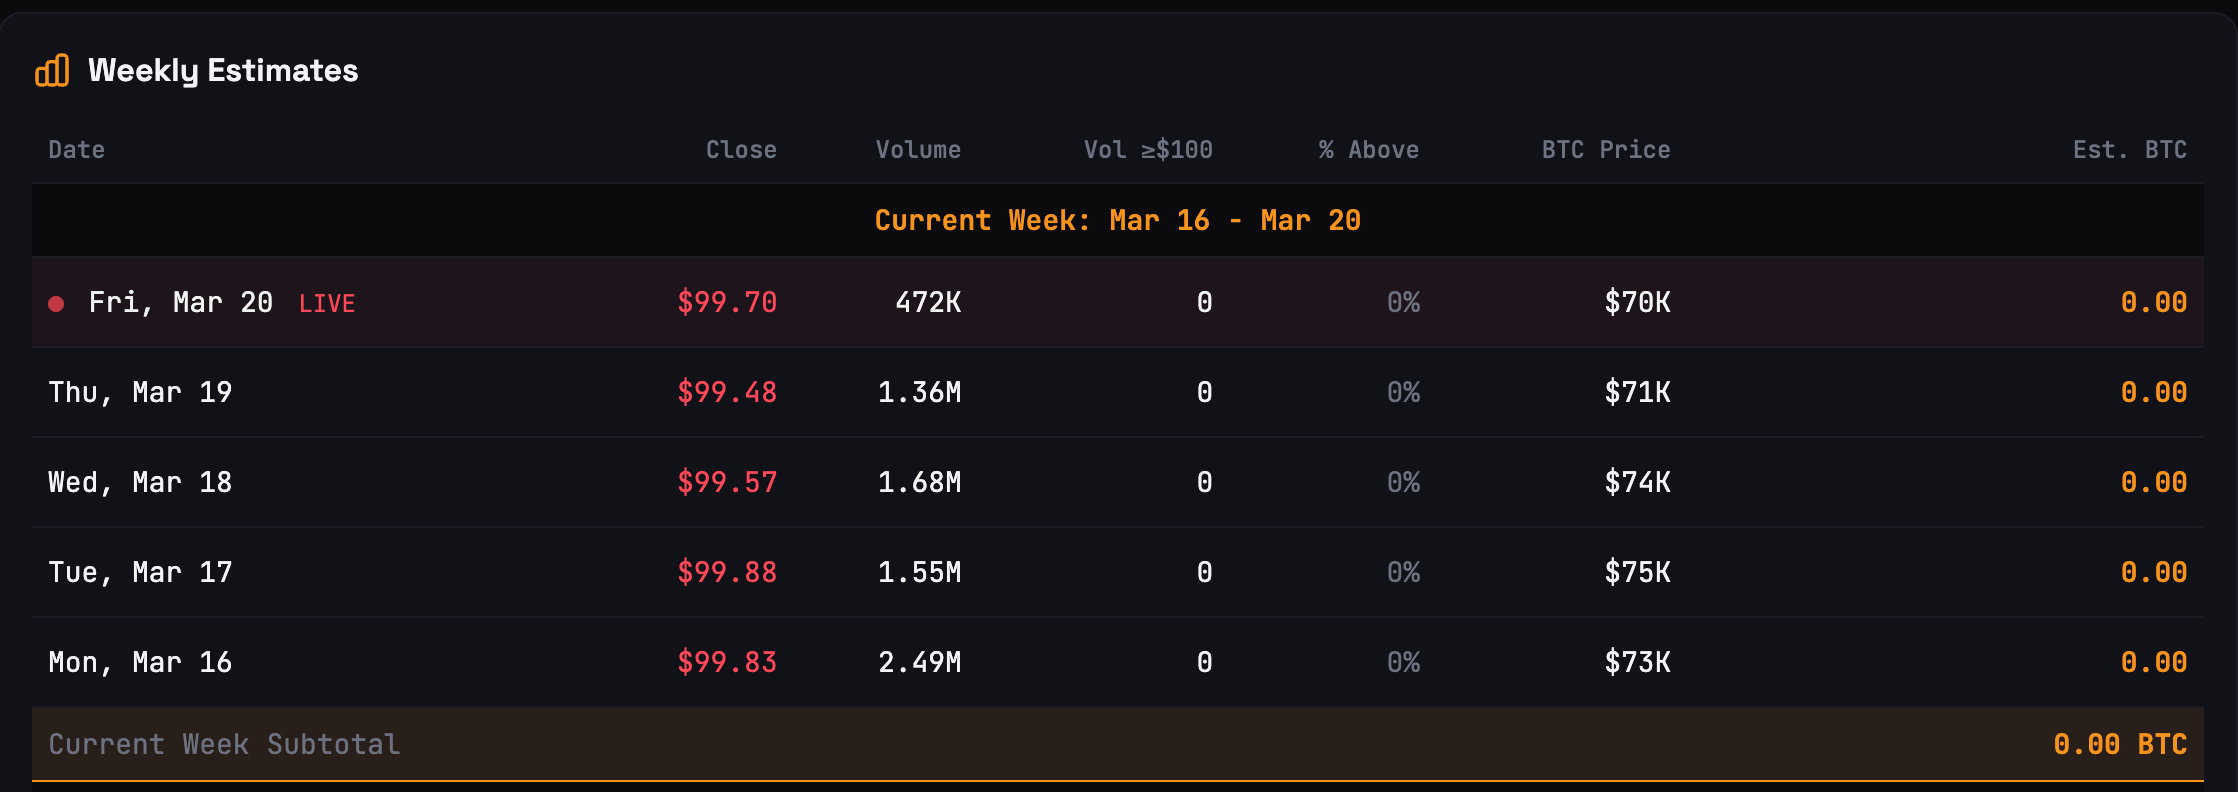 Strategy’s ATM sales dashboard. Source:
That matters because Strategy had recently been absorbing supply at a pace equal to multiple weeks of global mining output. Its absence removes a major source of demand just as macro risks are building.
Coinbase premium has also turned negative, signaling softer US demand amid the ongoing oil supply shock.
Disclaimer: The content of this article solely reflects the author's opinion and does not represent the platform in any capacity. This article is not intended to serve as a reference for making investment decisions.
You may also like
NEWMARK GROUP INC <NMRK.O>: KBW CUTS TARGET PRICE TO $16 FROM $17.50
NEWMARK GROUP INC : KBW CUTS TARGET PRICE TO $16 FROM $17.50
VALERO ENERGY CORP <VLO.N>: JEFFERIES CUTS TARGET PRICE TO $394 FROM $401
VALERO ENERGY CORP : JEFFERIES CUTS TARGET PRICE TO $394 FROM $401
Gold prices rise Rs 1,500/10g; silver up Rs 3,100/kg ahead of US economic data, softer yields. Buy, sell or hold?
The Shopify Stock Rally Isn't Done: Chart of the Week -- Barrons.com
By Doug Busch Shopify is no longer a pandemic-era growth story that simply failed to slow down. It is compounding at a pace few software platforms its size still manage. In the second quarter of 2026, sales on its platform rose 32%. That was the fifth straight quarter of growth exceeding 30%. Merchants are also using more of Shopify's own tools, from payments to Shop Pay, and new channels like AI shopping agents are starting to increase demand. The simple bull case is that the stock already commands a huge share of independent online commerce, and that position should become more valuable as more buying moves through its checkout. A rule of market mechanics is that the vast majority of an individual security's gain is driven by its underlying sector. Within technology, software has staged a robust recovery, joining semiconductors to power the broader sector higher. The iShares Expanded Tech-Software Sector ETF has maintained an upward trajectory since its mid-April lows, though the advance from $74 to $112 has been choppy as bulls repeatedly stepped in to defend when necessary. Breadth across large-cap software has expanded significantly, with 24 constituents surging over 20% over the past three months. During that same three-month window, Shopify generated outstanding relative strength, advancing 36%, more than doubling the IGV's 17% gain over the same period. Expect the stock's outperformance to persist as software momentum broadens. Let's examine the daily and monthly charts to outline the technical drivers behind this thesis. Looking at the daily chart, the ratio chart against the IGV shows persistent outperformance extending back to mid-May. The stock is riding an eight-session winning streak, during which price action cleared a double-bottom-with-handle pivot at $151.39. Within this broader base, the stock recorded a bullish golden cross in late August and successfully filled its Sept. 10 price gap, tracing back to its Aug. 4 session, the day before a powerful earnings reaction sent the stock surging 17% hi
Crypto prices
More


