
Bitcoin Price Breaks Legendary 14-Year Support, What This Means For The Market

By:Newsbtc
Bitget offers one-stop trading for cryptocurrencies, stocks, and gold. Trade now!
A welcome pack worth 6200 USDT for new users! Sign up now!
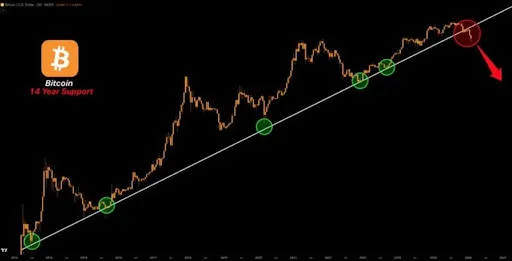
The Bitcoin price has broken below a legendary support level that had stood strong for 14 years, marking a major moment for the cryptocurrency. Market expert Crypto Tice has released a new analysis detailing the significance of this breach, warning of potential risks and a possible price shift. The recent downturn followsBTC’s latest surge after it cleared previous resistance levels, which pushed its price back towardthe $75,000 region.
Bitcoin Price Falls Below 14-Year Support Level
Sharing a price chart clearly illustrating the 14-year support on X, Crypto Tice emphasized that this trendline was far more than just another technical level, underscoring its strong significance. He explained that this line has historically defined every majorBitcoin bull market, consistently separating periods of robust price growth from phases with sharp declines. Furthermore, he noted, it has never broken without triggering major consequences.

The analyst went on to highlight that Bitcoin’s recent break below the support signals that the market can no longer rely on the patterns that once guided investor behavior. Once a support level of this magnitude fails, market volatility typically spikes as traders reassess their positions and liquidity shifts in search of new equilibrium zones. He also observed thatweaker hands are often forced out as more experienced investors take a patient stance, waiting for stability before making their next move.
var rnd = window.rnd || Math.floor(Math.random()*10e6); var pid607465 = window.pid607465 || rnd; var plc607465 = window.plc607465 || 0; var abkw = window.abkw || ''; var absrc = 'https://servedbyadbutler.com/adserve/;ID=172179;size=0x0;setID=607465;type=js;sw='+screen.width+';sh='+screen.height+';spr='+window.devicePixelRatio+';kw='+abkw+';pid='+pid607465+';place='+(plc607465++)+';rnd='+rnd+';click=CLICK_MACRO_PLACEHOLDER'; document.write('
');
if (!window.AdButler){(function(){var s = document.createElement("script"); s.async = true; s.type = "text/javascript";s.src = "https://servedbyadbutler.com/app.js";var n = document.getElementsByTagName("script")[0]; n.parentNode.insertBefore(s, n);}());}
var AdButler = AdButler || {}; AdButler.ads = AdButler.ads || []; var abkw = window.abkw || ""; var plc366606 = window.plc366606 || 0; (function(){ var divs = document.querySelectorAll(".plc366606:not([id])"); var div = divs[divs.length-1]; div.id = "placement_366606_"+plc366606; AdButler.ads.push({handler: function(opt){ AdButler.register(172179, 366606, [728,90], "placement_366606_"+opt.place, opt); }, opt: { place: plc366606++, keywords: abkw, domain: "servedbyadbutler.com", click:"CLICK_MACRO_PLACEHOLDER" }}); })();
Crypto Tice further explained that while Bitcoin could eventually reclaim the long-term trendline support, the market remains inrisk-management mode until that happens. He warned that ignoring a broken macro-support is not a sign of conviction but a form of denial.
 Source: X
Moreover, history shows that overlooking these foundational levels often leads tosharp sell-offs and accelerated Bitcoin repricing. The analyst noted that this reinforces the need to respect these types of structural chart signals rather than merely holding for aprice rebound.
While the overall implications of Crypto Tice’s analysis point to further declines andincreased volatility in Bitcoin, some members of the crypto community view the latest trendline break differently. One market analyst argued that rather than a signal of imminent collapse, breaking a 14-year support mark is an evolution in Bitcoin’s market structure. He explained that when historic levels like this fail, it often reflects the exhaustion of old patterns, not the start of a recession. The analyst concluded that new frameworks tend to emerge from those that have broken.
var rnd = window.rnd || Math.floor(Math.random()*10e6); var pid607472 = window.pid607472 || rnd; var plc607472 = window.plc607472 || 0; var abkw = window.abkw || ''; var absrc = 'https://servedbyadbutler.com/adserve/;ID=172179;size=0x0;setID=607472;type=js;sw='+screen.width+';sh='+screen.height+';spr='+window.devicePixelRatio+';kw='+abkw+';pid='+pid607472+';place='+(plc607472++)+';rnd='+rnd+';click=CLICK_MACRO_PLACEHOLDER'; document.write('
');
if (!window.AdButler){(function(){var s = document.createElement("script"); s.async = true; s.type = "text/javascript";s.src = "https://servedbyadbutler.com/app.js";var n = document.getElementsByTagName("script")[0]; n.parentNode.insertBefore(s, n);}());}
var AdButler = AdButler || {}; AdButler.ads = AdButler.ads || []; var abkw = window.abkw || ""; var plc452518 = window.plc452518 || 0; (function(){ var divs = document.querySelectorAll(".plc452518:not([id])"); var div = divs[divs.length-1]; div.id = "placement_452518_"+plc452518; AdButler.ads.push({handler: function(opt){ AdButler.register(172179, 452518, [728,90], "placement_452518_"+opt.place, opt); }, opt: { place: plc452518++, keywords: abkw, domain: "servedbyadbutler.com", click:"CLICK_MACRO_PLACEHOLDER" }}); })();

Bitcoin Sheds Over $5,000 With New Crash
In just one day,the Bitcoin price has crashed, losing roughly $5,000 after its recent rebound above $75,000. CoinMarketCap data shows the decline is ongoing, with no immediate signs of stabilizing.
Notably, the latest decline has been driven primarily bya hawkish Federal Reserve (FED) outlook amid rising geopolitical tensions. Reports indicate that investor sentiment shifted sharply, turning risk-off following the latest FED warning. In addition,a surge in whale sell-offs and a wave of leveraged long liquidations have put significant pressure on the Bitcoin price.
 BTC price reclaims $71,000 again | Source:
BTCUSD on Tradingview.com
BTC price reclaims $71,000 again | Source:
BTCUSD on Tradingview.com
0
0
Disclaimer: The content of this article solely reflects the author's opinion and does not represent the platform in any capacity. This article is not intended to serve as a reference for making investment decisions.
Understand the market, then trade.
Bitget offers one-stop trading for cryptocurrencies, stocks, and gold.
Trade now!
You may also like
NEWMARK GROUP INC <NMRK.O>: KBW CUTS TARGET PRICE TO $16 FROM $17.50
NEWMARK GROUP INC : KBW CUTS TARGET PRICE TO $16 FROM $17.50
Reuters•2026/10/09 05:31
VALERO ENERGY CORP <VLO.N>: JEFFERIES CUTS TARGET PRICE TO $394 FROM $401
VALERO ENERGY CORP : JEFFERIES CUTS TARGET PRICE TO $394 FROM $401
Reuters•2026/10/09 04:52
Gold prices rise Rs 1,500/10g; silver up Rs 3,100/kg ahead of US economic data, softer yields. Buy, sell or hold?
EconomicTimes•2026/10/09 04:51
The Shopify Stock Rally Isn't Done: Chart of the Week -- Barrons.com
By Doug Busch Shopify is no longer a pandemic-era growth story that simply failed to slow down. It is compounding at a pace few software platforms its size still manage. In the second quarter of 2026, sales on its platform rose 32%. That was the fifth straight quarter of growth exceeding 30%. Merchants are also using more of Shopify's own tools, from payments to Shop Pay, and new channels like AI shopping agents are starting to increase demand. The simple bull case is that the stock already commands a huge share of independent online commerce, and that position should become more valuable as more buying moves through its checkout. A rule of market mechanics is that the vast majority of an individual security's gain is driven by its underlying sector. Within technology, software has staged a robust recovery, joining semiconductors to power the broader sector higher. The iShares Expanded Tech-Software Sector ETF has maintained an upward trajectory since its mid-April lows, though the advance from $74 to $112 has been choppy as bulls repeatedly stepped in to defend when necessary. Breadth across large-cap software has expanded significantly, with 24 constituents surging over 20% over the past three months. During that same three-month window, Shopify generated outstanding relative strength, advancing 36%, more than doubling the IGV's 17% gain over the same period. Expect the stock's outperformance to persist as software momentum broadens. Let's examine the daily and monthly charts to outline the technical drivers behind this thesis. Looking at the daily chart, the ratio chart against the IGV shows persistent outperformance extending back to mid-May. The stock is riding an eight-session winning streak, during which price action cleared a double-bottom-with-handle pivot at $151.39. Within this broader base, the stock recorded a bullish golden cross in late August and successfully filled its Sept. 10 price gap, tracing back to its Aug. 4 session, the day before a powerful earnings reaction sent the stock surging 17% hi
Dow Jones•2026/10/09 03:10
Crypto prices
More
Bitcoin
BTC
$82,567.38
-0.50%

Ethereum
ETH
$2,500.83
-2.55%

Tether USDt
USDT
$0.9991
-0.02%

BNB
BNB
$744.21
-3.21%

XRP
XRP
$1.4
-0.42%

USDC
USDC
$0.9998
-0.01%

Solana
SOL
$110.43
-3.91%

TRON
TRX
$0.3319
-0.81%

Hyperliquid
HYPE
$85.96
-1.51%

Zcash
ZEC
$1,226.95
-1.07%
How to buy BTC
Bitget lists BTC – Buy or sell BTC quickly on Bitget!
Trade now
Become a trader now?A welcome pack worth 6200 USDT for new users!
Sign up now