

 thecryptobasic.com
The price of Shiba Inu is exhibiting intense volatility, yet market participants seem to be accumulating the meme coin, as evidenced in exchange netflows.
Notably, this metric tracks the difference between coins entering exchanges and those leaving. With net inflow turning negative, it suggests that there are more Shiba Inu ($SHIB) tokens withdrawn from trading platforms than deposited.
Key Points
- Over the past 24 hours, the total exchange netflow was -84.014 billion, up 0.56% in the same timeframe.
- This negative netflow indicates outflows overshadowed inflows, suggesting accumulation among holders rather than distribution.
- The accumulation coincided with a period of directional uncertainty for $SHIB, during which it fell for three straight days before bouncing 5% today.
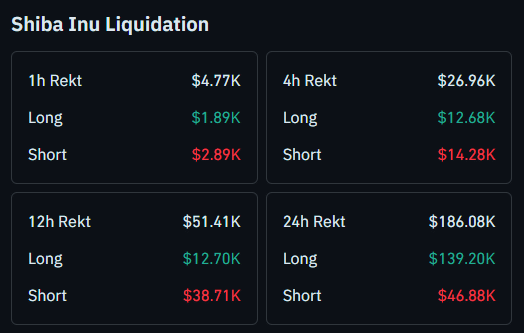
- The price fluctuation has spiked liquidation, with around $186,080 worth of Shiba Inu positions wiped out in the past 24 hours.
Billions of Shiba Inu Leaves Exchanges
CryptoQuant data confirms this strong accumulation course. Specifically, over the past 24 hours, the total exchange netflow was -84.014 billion, up 0.56% in the same timeframe.
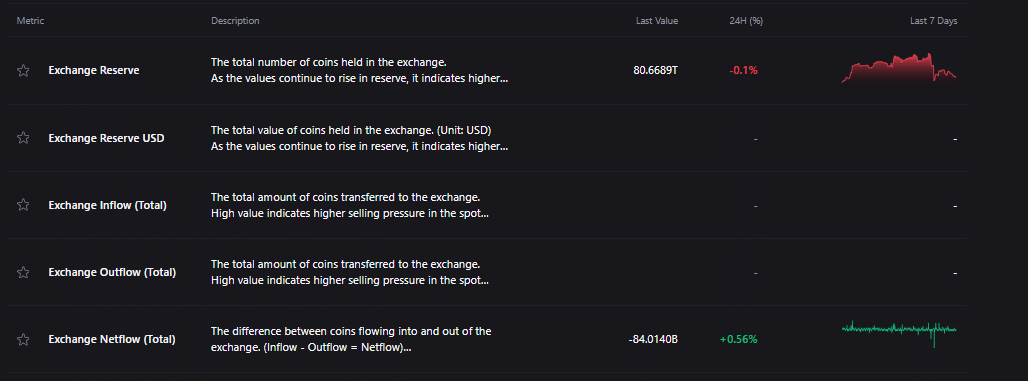
Notably, this negative flow indicates outflows overshadowed inflows, suggesting accumulation among holders rather than distribution. Higher outflows reflect a shift of $SHIB tokens from platforms where they can be immediately sold to self-custody wallets or third-party systems for potential long-term holding. This significantly reduces selling pressure for Shiba Inu.
Coinglass data confirmed this holder bias. Its Shiba Inu spot flow data shows that inflows to exchanges in the past 24 hours stood at $5.95 million, with outflows at $6.13 million. This culminates in a difference of $181,350, representing roughly 30 billion $SHIB tokens at the current market price of $0.000006061.
Although it is significantly lower than CryptoQuant’s, it confirms that there is still demand for Shiba Inu despite the recent price volatility.
Shiba Inu Dumps Then Bounces
The accumulation coincided with a period of price uncertainty for the second-largest meme coin by market cap. $SHIB fell for three straight days, starting Tuesday, losing 6% of its value after a rejection at $0.00000644 the day before.
However, the price is up over 5% since the start of today, after an uptrend in the Asian trading session. The bounce followed a dragonfly doji candlestick formation on the daily chart yesterday, indicating that bears lost control of the market towards the end.
To some, this might come across as increased volatility, but to others, it is a show of strength. Shiba Inu showed resilience, not allowing geopolitical tensions to continue suppressing its upward momentum. At the time of writing, the token is close to gaining back all it lost in the three days it corrected and could complete this turnaround if the current momentum persists.
Meanwhile, this price fluctuation has spiked liquidation in the past 24 hours. Around $186,080 worth of Shiba Inu positions were wiped out during this timeframe, with a chunk of them being bullish positions.
For context, $139,200 of this figure were longs, with just $46,880 shorts. However, lower timeframes show that bears are beginning to feel the heat amid the ongoing market rebound. In the 12-hour timeframe, for instance, the total short liquidation exceeded longs, with $38,710 for shorts and $12,700 for long positions. The same trend prevails across other shorter timeframes.
In the meantime, $SHIB trades at the $0.000060 resistance area. Breaking above opens the way to higher prices, while a rejection could take it to the minor and major support levels at $0.00000545 and $0.00000507.


