
Bitcoin RSI eyes 2022 repeat as analysis suggests 'time to pay attention'

Bitcoin (BTC) is hinting at its next long-term bottom as a key leading indicator preps a higher low.
Key points:
Bitcoin RSI is approaching a critical long-term position for the fate of the bear market.
RSI needs a weekly bullish divergence to repeat its early-2023 rebound.
A trader says he is “not in a rush” to reenter the market with the comedown from all-time highs just a few months old.
Bitcoin RSI: All eyes on higher low
New analysis covering relative strength index (RSI) data on BTC/USD concludes it could soon be “time to pay attention.”
Bitcoin bear-market bottoms often follow the start of a bullish divergence with RSI on weekly time frames.
For trader Jelle, current market behavior is following historical trends, and Bitcoin’s next inflection point may be around the corner.
“When $BTC's weekly RSI makes a higher low again, it's time to pay attention,” he wrote on X.
A classic bullish divergence locks in when RSI makes a higher low while price makes lower lows. Jelle, however, says that price has room to maneuver and still preserve the emerging recovery.
“Doesn't matter if BTC makes a higher low, equal low, or lower low,” he continued.
“When RSI starts moving higher again, the bottom is very close - or already in.”
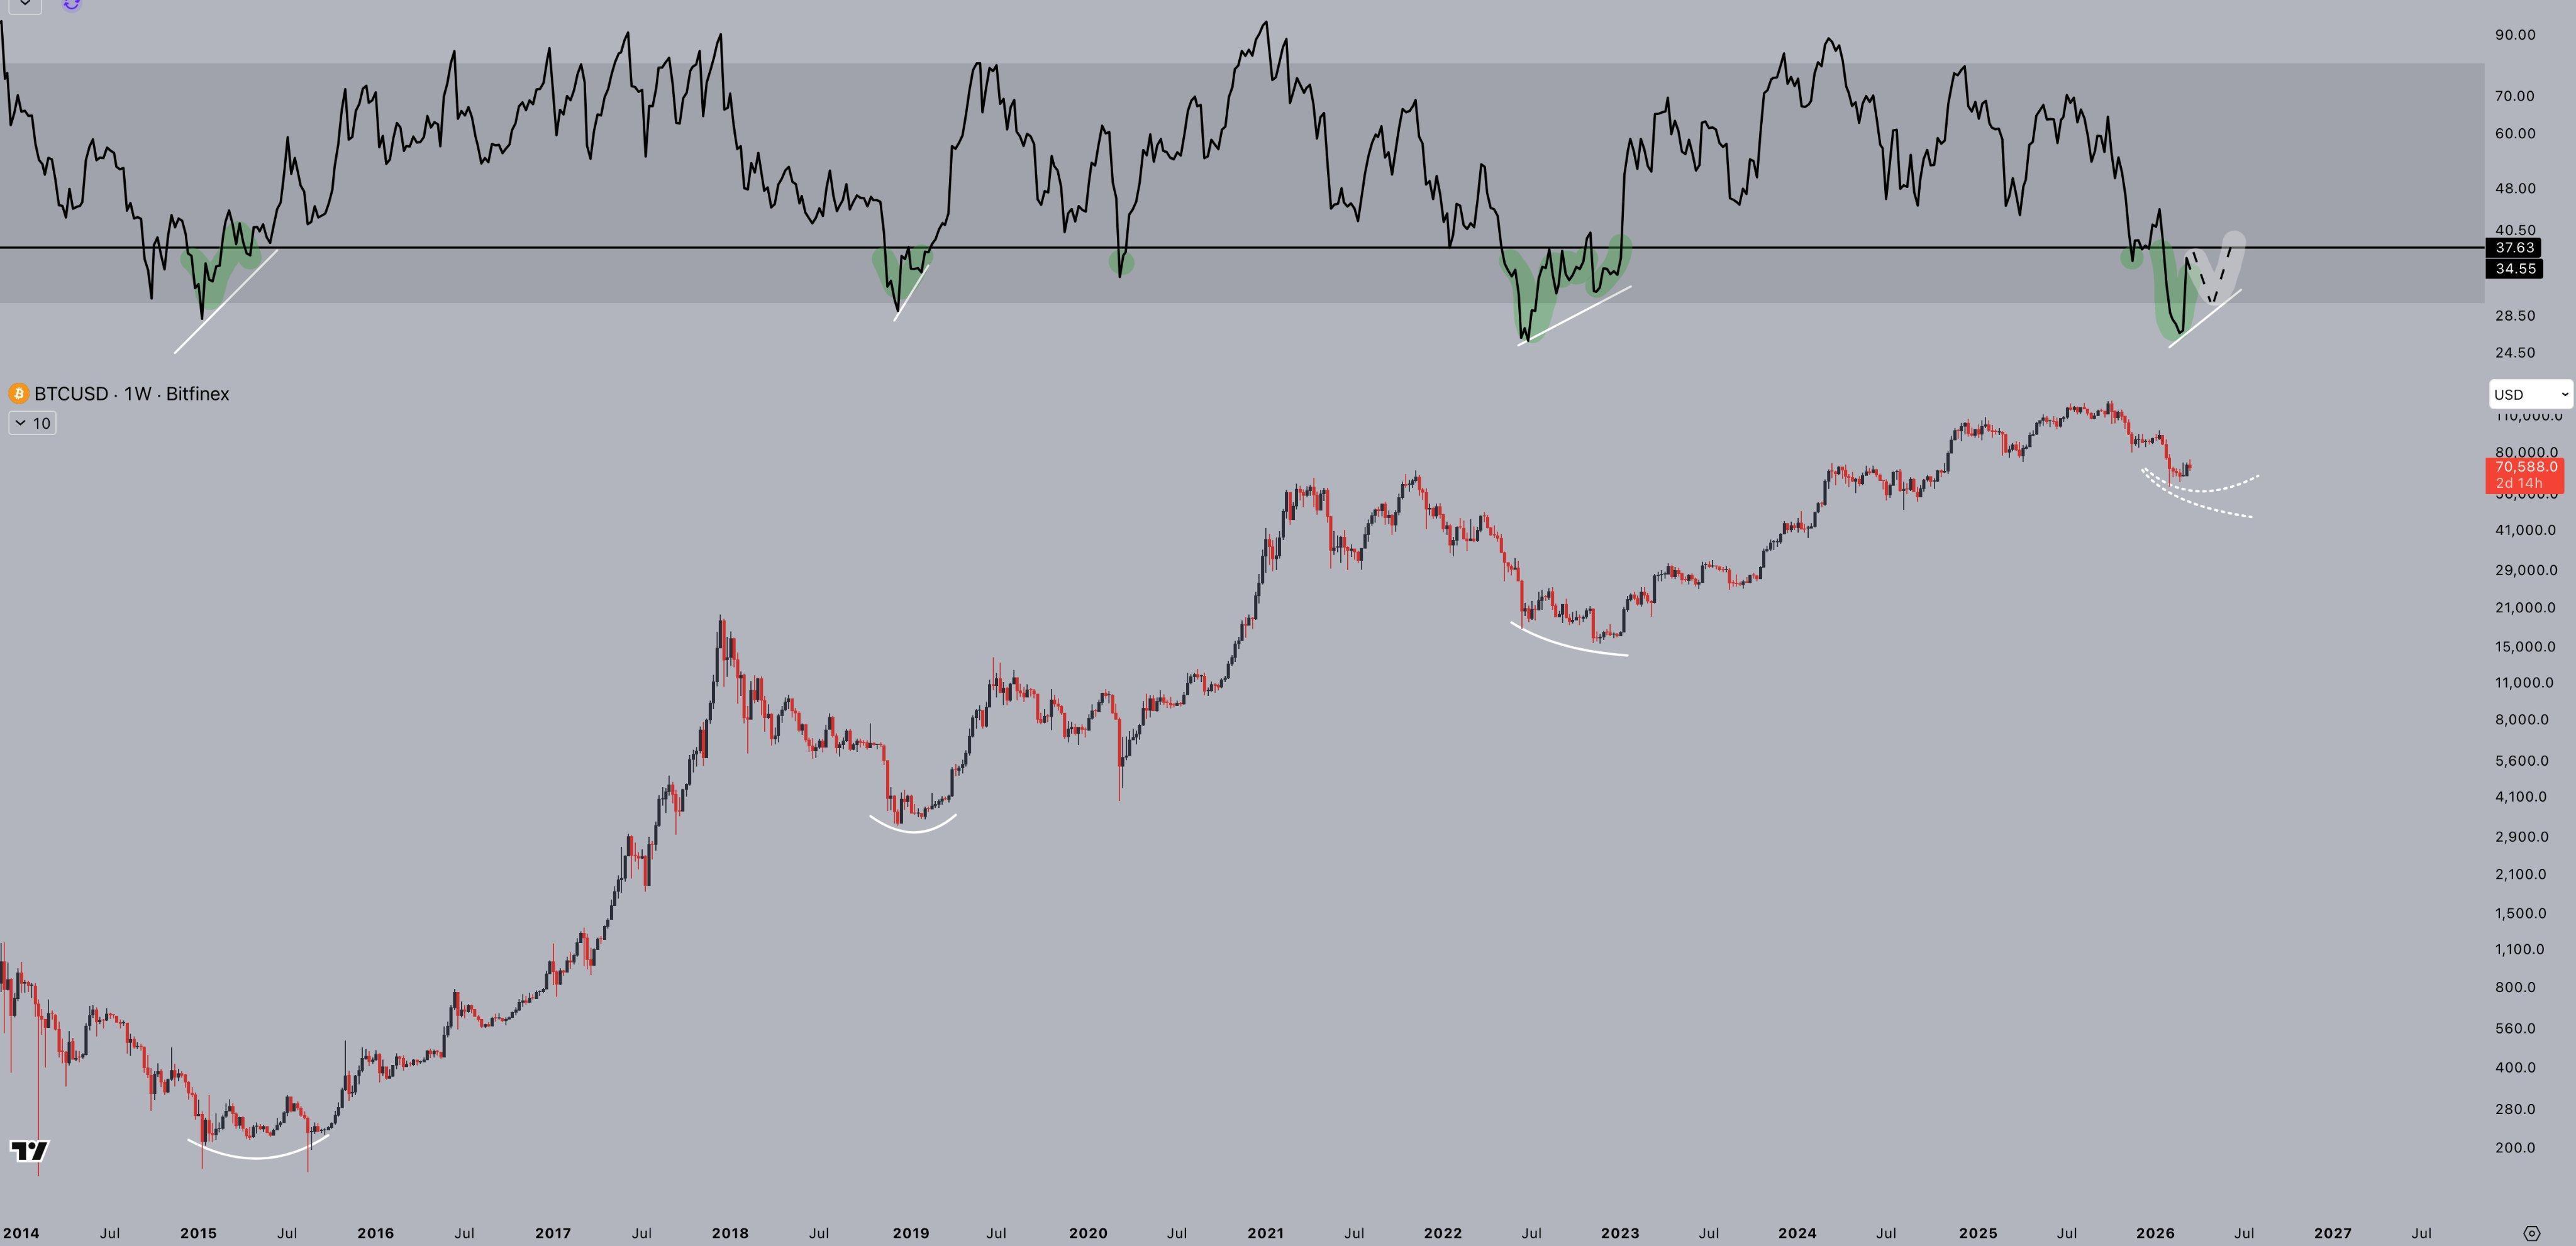 BTC/USD one-week chart with RSI data. Source: Jelle/X
BTC price bear flag still in play
RSI last flipped bullish at the end of Bitcoin’s 2022 bear market, and its signals preceded a period of upside that continued for over a year.
Related: Bitcoin tests old 2021 top as gold falls to six-week lows under $4.7K
At the time, talk also focused on reclaiming the 200-week exponential moving average (EMA) as support, something that occurred in March 2023.
As reported, the 200-week EMA was only lost again last month, with analysis calling the trend line “unreliable.”
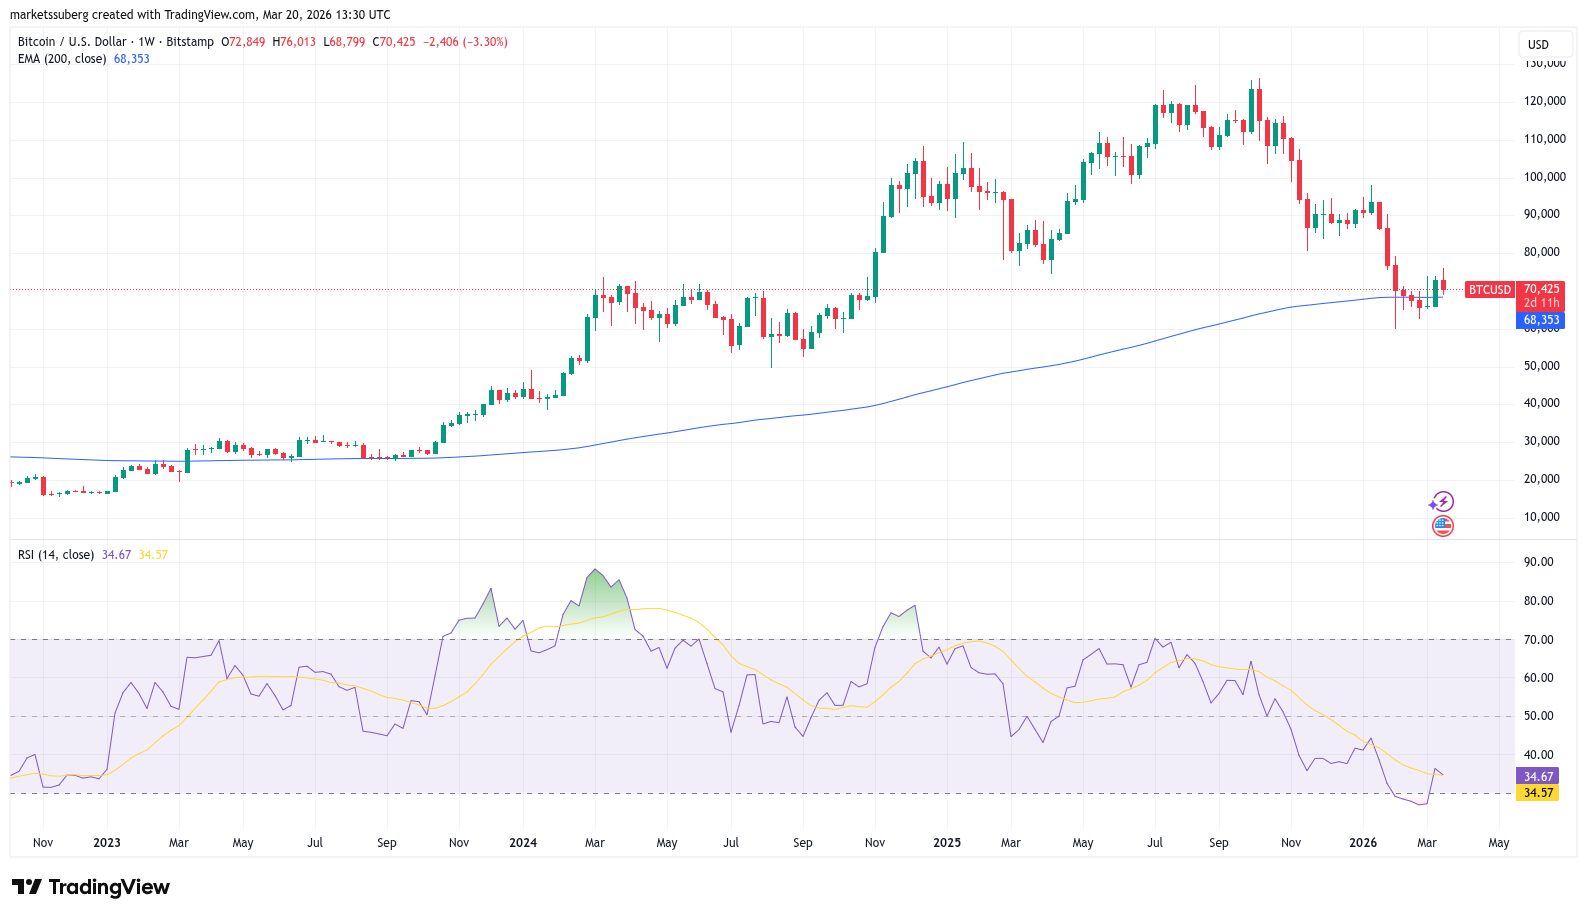 BTC/USD one-week chart with RSI, 200-week EMA. Source: Cointelegraph/
TradingView
BTC/USD one-week chart with RSI, 200-week EMA. Source: Cointelegraph/
TradingView
Jelle, meanwhile, is among those speculating that previous cycles demand a much longer bear market than the few months that have elapsed so far.
“Previous bear markets all lasted around a year. $BTC topped just 23 weeks ago, and looks like this,” he told X followers.
“I'm not in a rush to buy back in.”
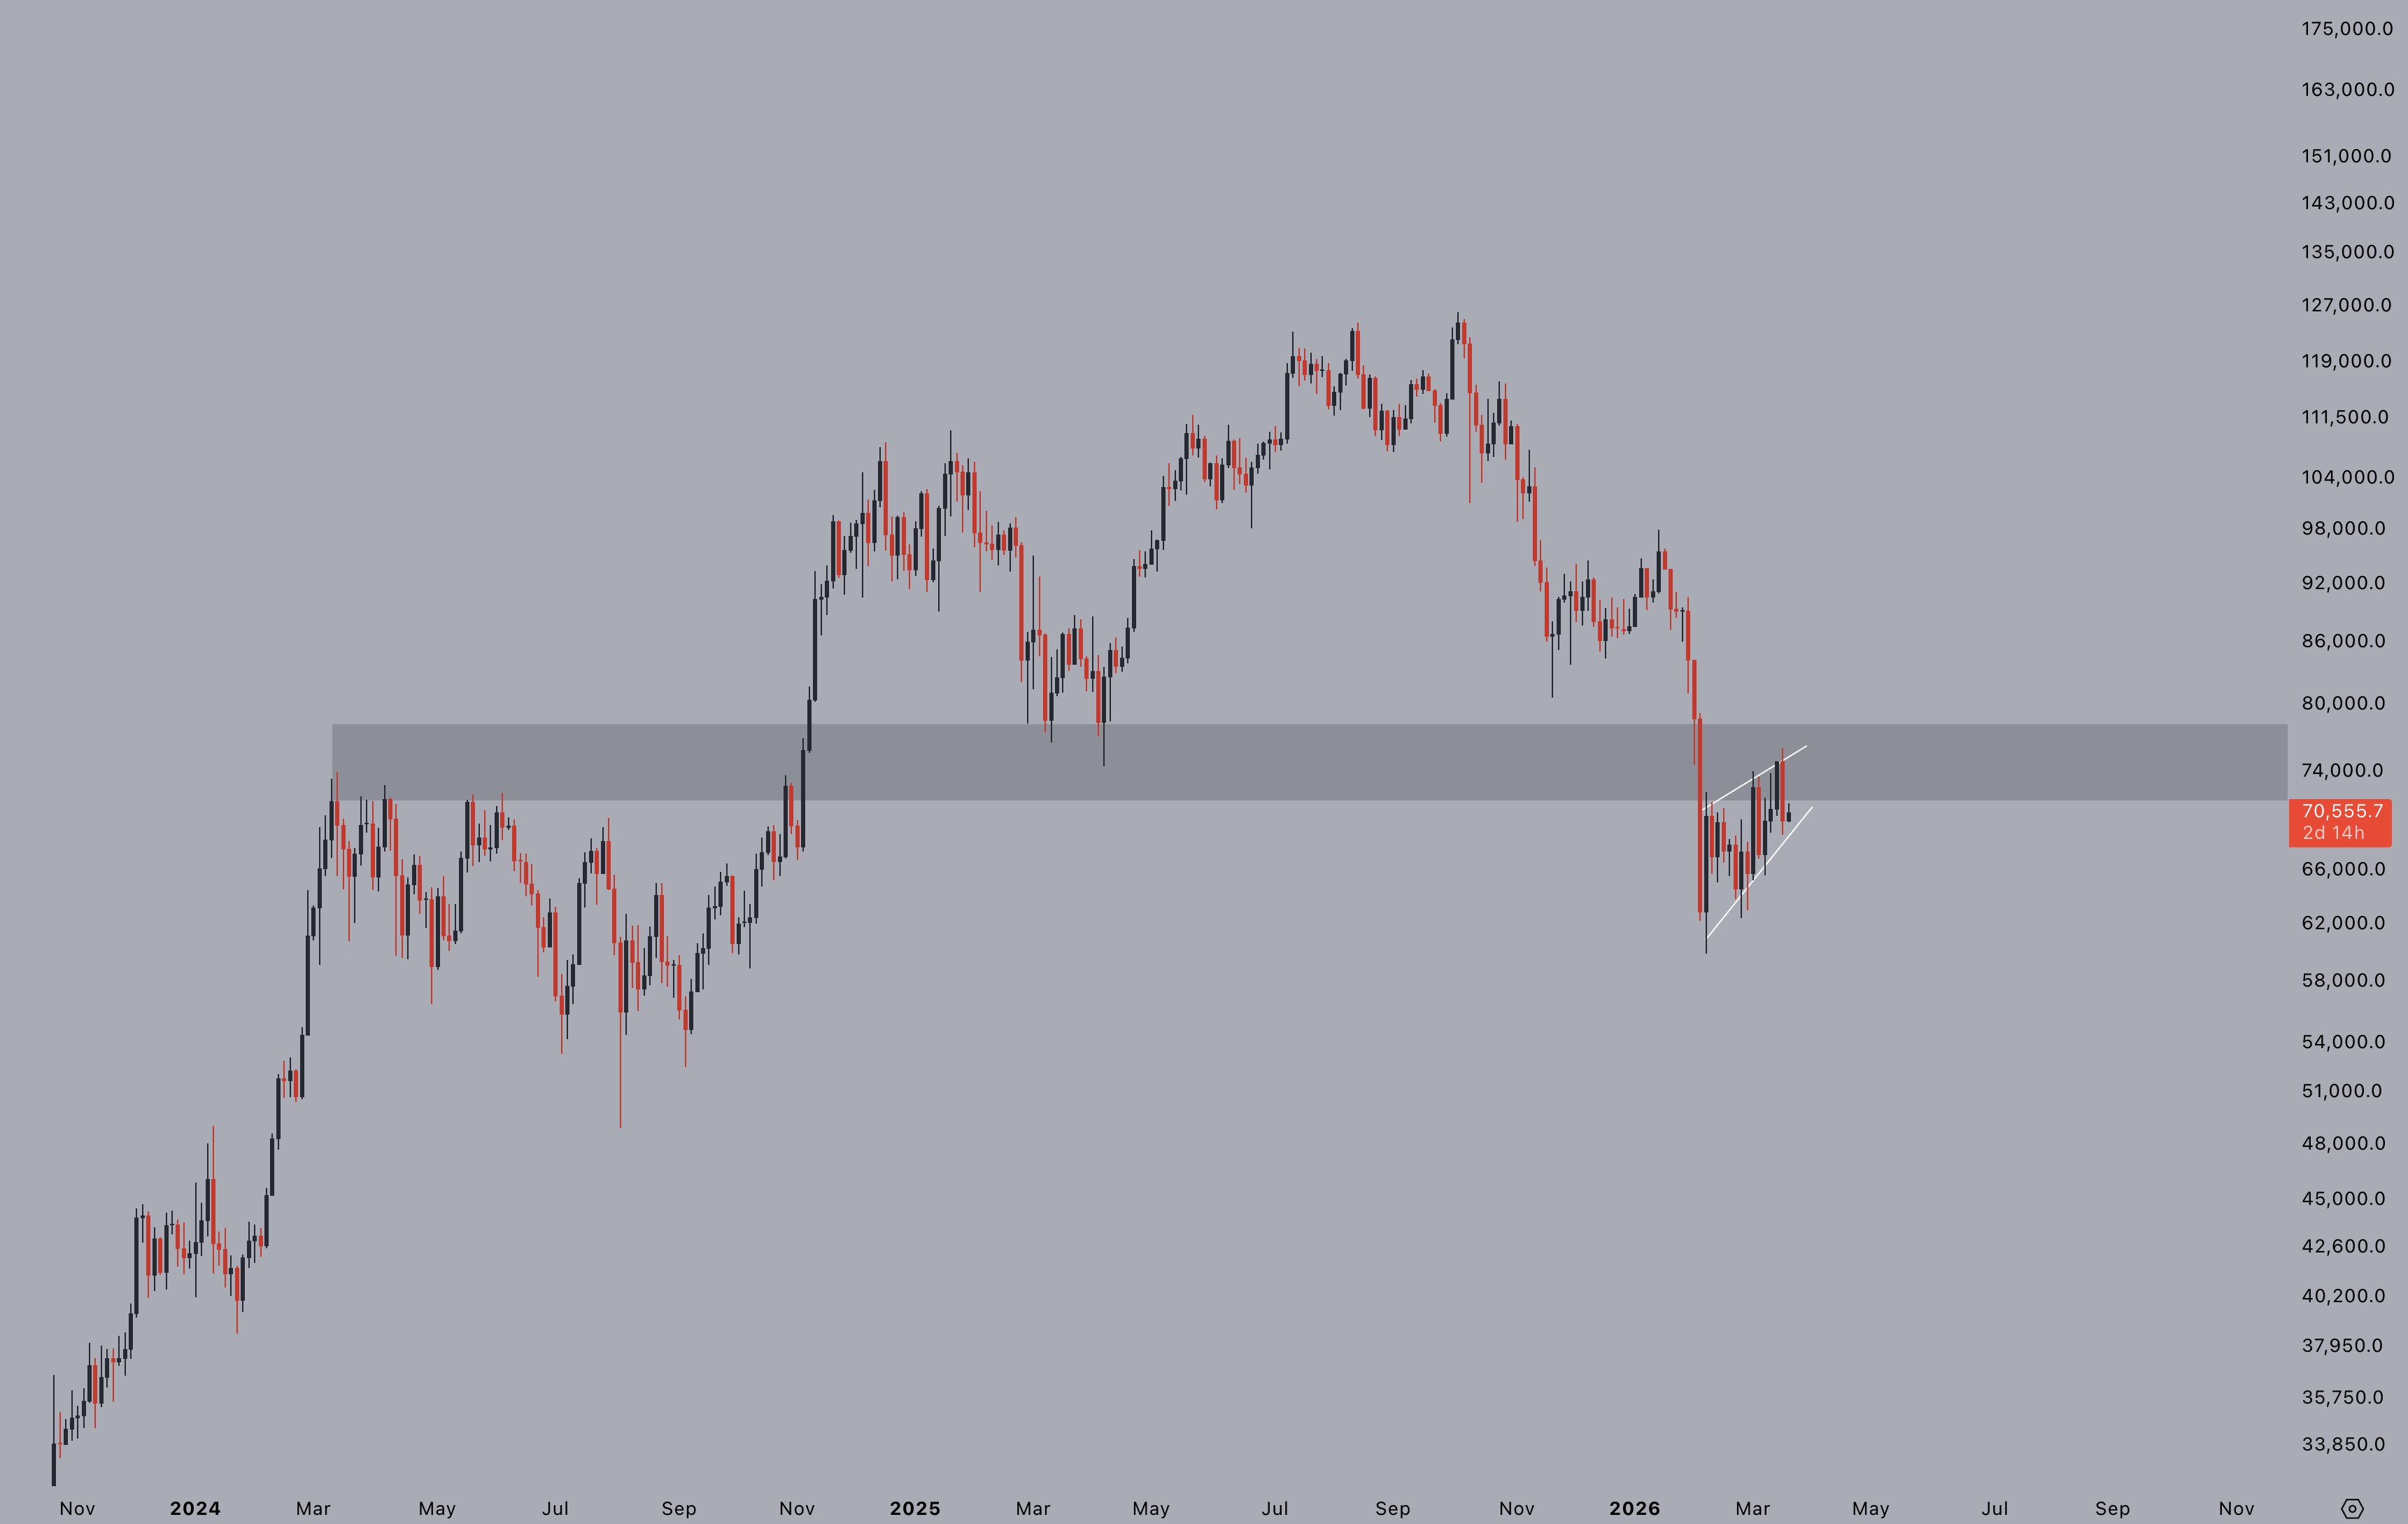 BTC/USD chart. Source: Jelle/X
A separate chart drew attention to a possible bear flag formation under development — a sign of weakness that could result in a fresh support failure in a manner similar to January.
Disclaimer: The content of this article solely reflects the author's opinion and does not represent the platform in any capacity. This article is not intended to serve as a reference for making investment decisions.
You may also like
Trump Entered Before Muse AI's Surge! Accurate Meta and SpaceX Rebound Trades in August, Bought SpaceX Bonds Ahead of New Aerospace Policies
In August, Trump's account conducted 517 securities transactions with a total transaction amount of approximately $74.3 million to $273.3 million, including the purchase of $5 million to $25 million worth of Meta stock.
JPMorgan analyzes Applied (APLD.US): AI computing power business advancing rapidly, facing real-world challenges with billion-dollar financing
JPMorgan's Credit Research team has released a report providing a comprehensive analysis of company operations, project progress, financing pressures, and risks.

Crypto: Pump.fun Earns $18.6M Despite Memecoin Slump

Crypto prices
More


