

Artificial Superintelligence Alliance (FET) has drawn renewed attention after a sharp recovery, with price action signaling a clear shift in market structure. The token now trades at $0.2317, while weekly gains approach 26%, reflecting strong bullish momentum.
Besides the price surge, technical signals suggest that buyers have regained control after a prolonged period of consolidation. Consequently, traders now focus on whether this breakout can sustain or fade into another corrective phase.
FET recently surged from the $0.14 region to approximately $0.25, confirming a decisive trend reversal. This move broke the prior downtrend and established a stronger bullish structure.
However, the price now faces immediate pressure between $0.231 and $0.235. This zone previously acted as resistance and now demands a successful flip into support.
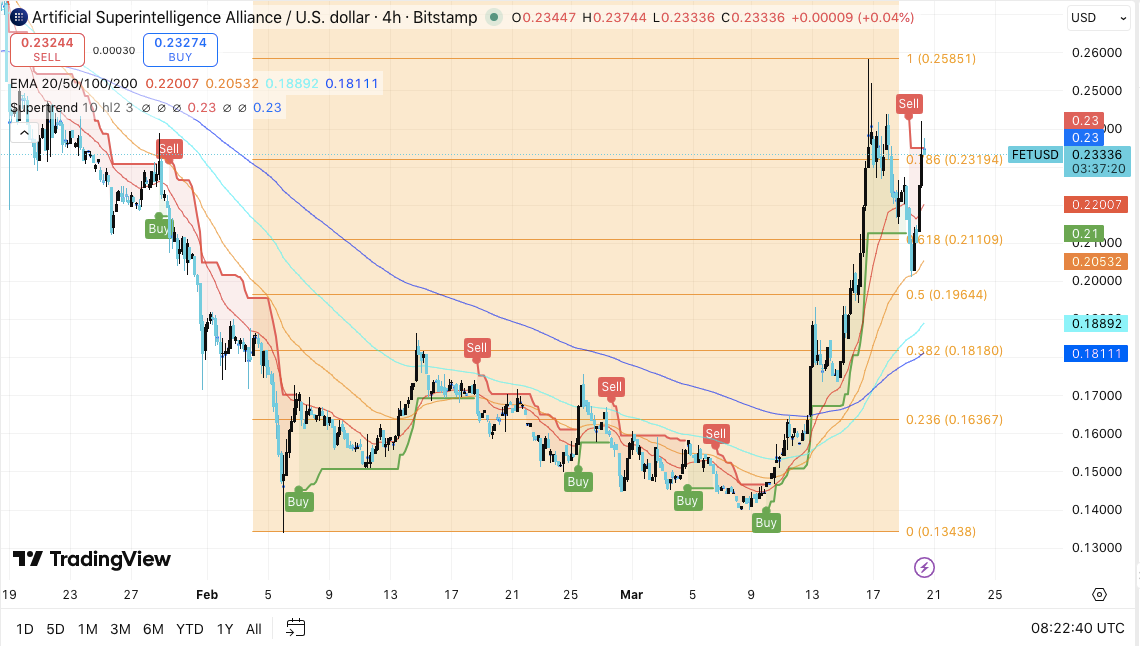
Besides, a more critical barrier sits between $0.258 and $0.262. This range aligns with a major Fibonacci level and past rejection points. A clean breakout above this zone could open the path toward $0.28 and potentially $0.30. However, failure to break higher may trigger short-term consolidation.
Additionally, technical indicators suggest caution. The rally appears extended, and momentum indicators signal near-overbought conditions. Hence, a brief cooling period could emerge before the next directional move.
On the downside, the $0.210 to $0.205 range stands as a crucial support area. This zone combines key Fibonacci levels with strong historical reactions. Losing this support would likely shift momentum and invite deeper retracement.
Moreover, secondary support lies between $0.196 and $0.188. This region offers a potential entry for buyers during pullbacks. If selling pressure intensifies, the $0.180 to $0.163 zone becomes the next defensive layer. A breakdown below this structure would weaken the broader bullish outlook.
Significantly, the macro base between $0.134 and $0.150 remains intact. This level previously marked accumulation and continues to support long-term sentiment.
 Source:
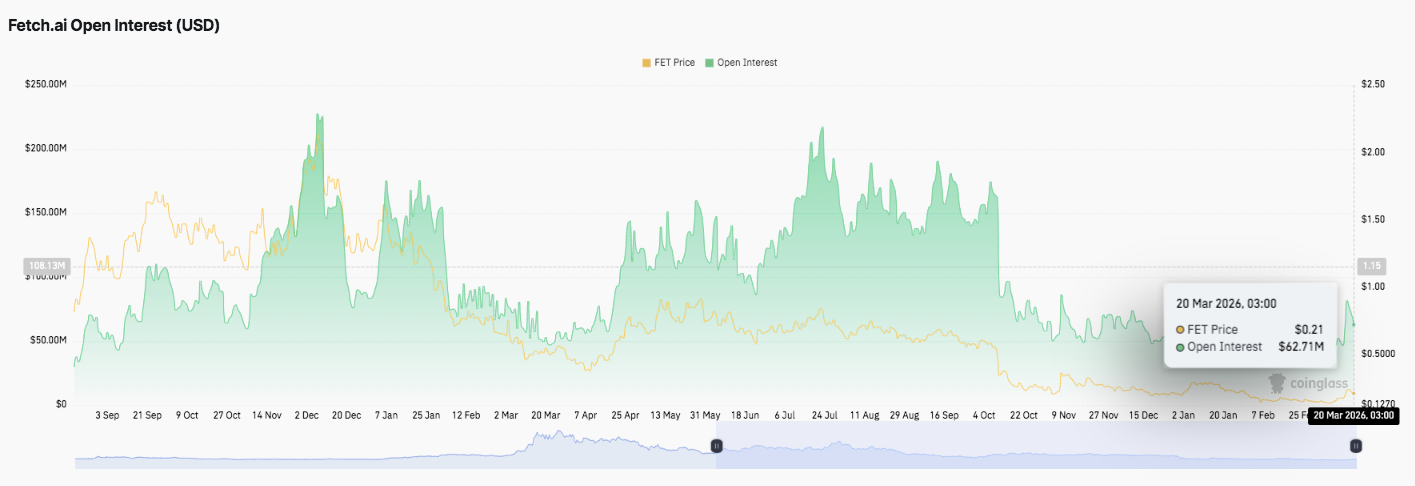
While price action shows strength, participation metrics tell a more cautious story. Open interest has declined notably from earlier peaks above $200 million. It now stabilizes closer to $50 million to $70 million. This trend indicates reduced leverage and lower speculative activity.
 Source:
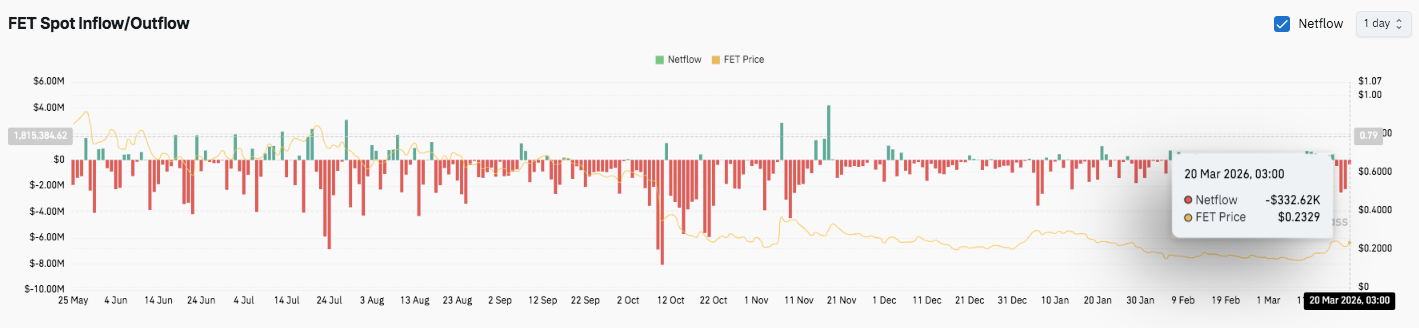
Furthermore, netflow data highlights persistent outflows across recent months. Sellers continue to dominate, although pressure has eased slightly in recent weeks. Consequently, the market reflects cautious optimism rather than full conviction.
Key levels for Artificial Superintelligence Alliance remain clearly defined as price consolidates after a strong 26% weekly rally. The market now trades near a decisive zone, where both continuation and rejection scenarios remain possible. Besides, recent structure shifts highlight a transition from accumulation into a developing uptrend.
Upside levels: Immediate resistance sits at $0.231–$0.235, which acts as the first hurdle for bulls. A clean breakout above this range could push price toward $0.258–$0.262. Moreover, sustained strength above $0.26 may open the path toward $0.28 and $0.30 in extension.
Downside levels: Initial support stands at $0.210–$0.205, which remains critical for maintaining bullish structure. Below that, $0.196 and $0.188 provide mid-range support zones. Additionally, deeper weakness could expose the $0.180–$0.163 region, which marks broader structural demand.
Resistance ceiling: The $0.258–$0.262 zone remains the key level to flip for stronger trend continuation. This region aligns with major Fibonacci retracement levels and recent rejection points. Hence, reclaiming it would confirm sustained bullish momentum.
The technical structure suggests FET is entering a consolidation phase after an impulsive breakout. Consequently, price may compress within a range before the next directional move. This type of setup often leads to volatility expansion once a breakout occurs.
FET’s short-term outlook depends on whether buyers can defend the $0.21 support zone while building pressure below $0.235. Moreover, holding above this region would signal strength and increase the probability of another upward leg.
If bullish momentum continues, price could retest $0.26 and extend toward $0.28 or even $0.30. However, this scenario requires stronger participation and improved market conviction. Additionally, reduced open interest suggests traders remain cautious, which may limit aggressive upside moves.
On the downside, losing $0.205 would weaken the structure and likely trigger a pullback toward $0.196 or lower. Consequently, failure to hold key support could shift sentiment back toward consolidation or short-term bearish pressure.
For now, FET trades within a pivotal zone where both scenarios remain valid. Momentum favors buyers, but confirmation above resistance will determine the next sustained move.


