
Can XRP price soar to $2 as multiple bullish patterns form?

XRP price rebounded back above $1.45 on Friday after bulls managed to defend the $1.40 support during the market-wide bloodbath over the past day.
- XRP rebounded above $1.45 after defending $1.40 support, despite broader market weakness driven by geopolitical tensions and risk-off sentiment.
- Whale accumulation of over 200 million XRP and $150 million in institutional holdings signals renewed interest, alongside speculation of a potential XRP treasury.
- Technical setup shows a descending channel and a rounded bottom, with a breakout above $1.69 potentially opening upside toward $2.1.
After falling nearly 11% from its weekly high to $1.45 on March 19, XRP (XRP) price bounced back to $1.45 at the last check on Friday, March 20.
XRP price fell as the broader crypto market tanked amid escalating war concerns in the Middle East, which has left investors to move to a derisking mode as they turn toward gold and other safe-haven assets to park their capital until concerns cool off.
Despite the recent volatility, a few key developments could support a potential recovery for the asset.
First, whales have returned to accumulation mode in recent weeks, a major signal that often influences retail sentiment.
In a recent X post, market analyst Ali Martinez shared on-chain data that shows XRP whales have accumulated at least 200 million XRP over the past two weeks.
Second, Goldman Sachs, one of the world’s leading investment banks, has now become the largest institutional holder of XRP in the U.S. The banking giant reportedly holds over $150 million worth of XRP across four spot XRP funds, more than the combined holdings of the next 29 institutional holders in line.
Such massive endorsements from prominent financial institutions could drive greater appeal for the token as it transitions into a mainstream investment vehicle.
Third, investor hype is also building over an XRP treasury reserve being established by Evernorth. Such a move could mirror the approach taken by Michael Saylor with Bitcoin at Strategy and help to solidify XRP as a cornerstone institutional asset.
The firm said it will be the largest XRP holder after its public listing. The strategic move could give XRP more visibility and prestige in the eyes of traditional investors who are looking for regulated exposure to the crypto market.
XRP price analysis
On the daily chart, XRP price has respected a descending parallel channel pattern in which it has been trading since mid-July 2025. A breakout from such a bullish reversal pattern has typically been a precursor to a sustained rally as it signals the end of a long-term corrective phase.
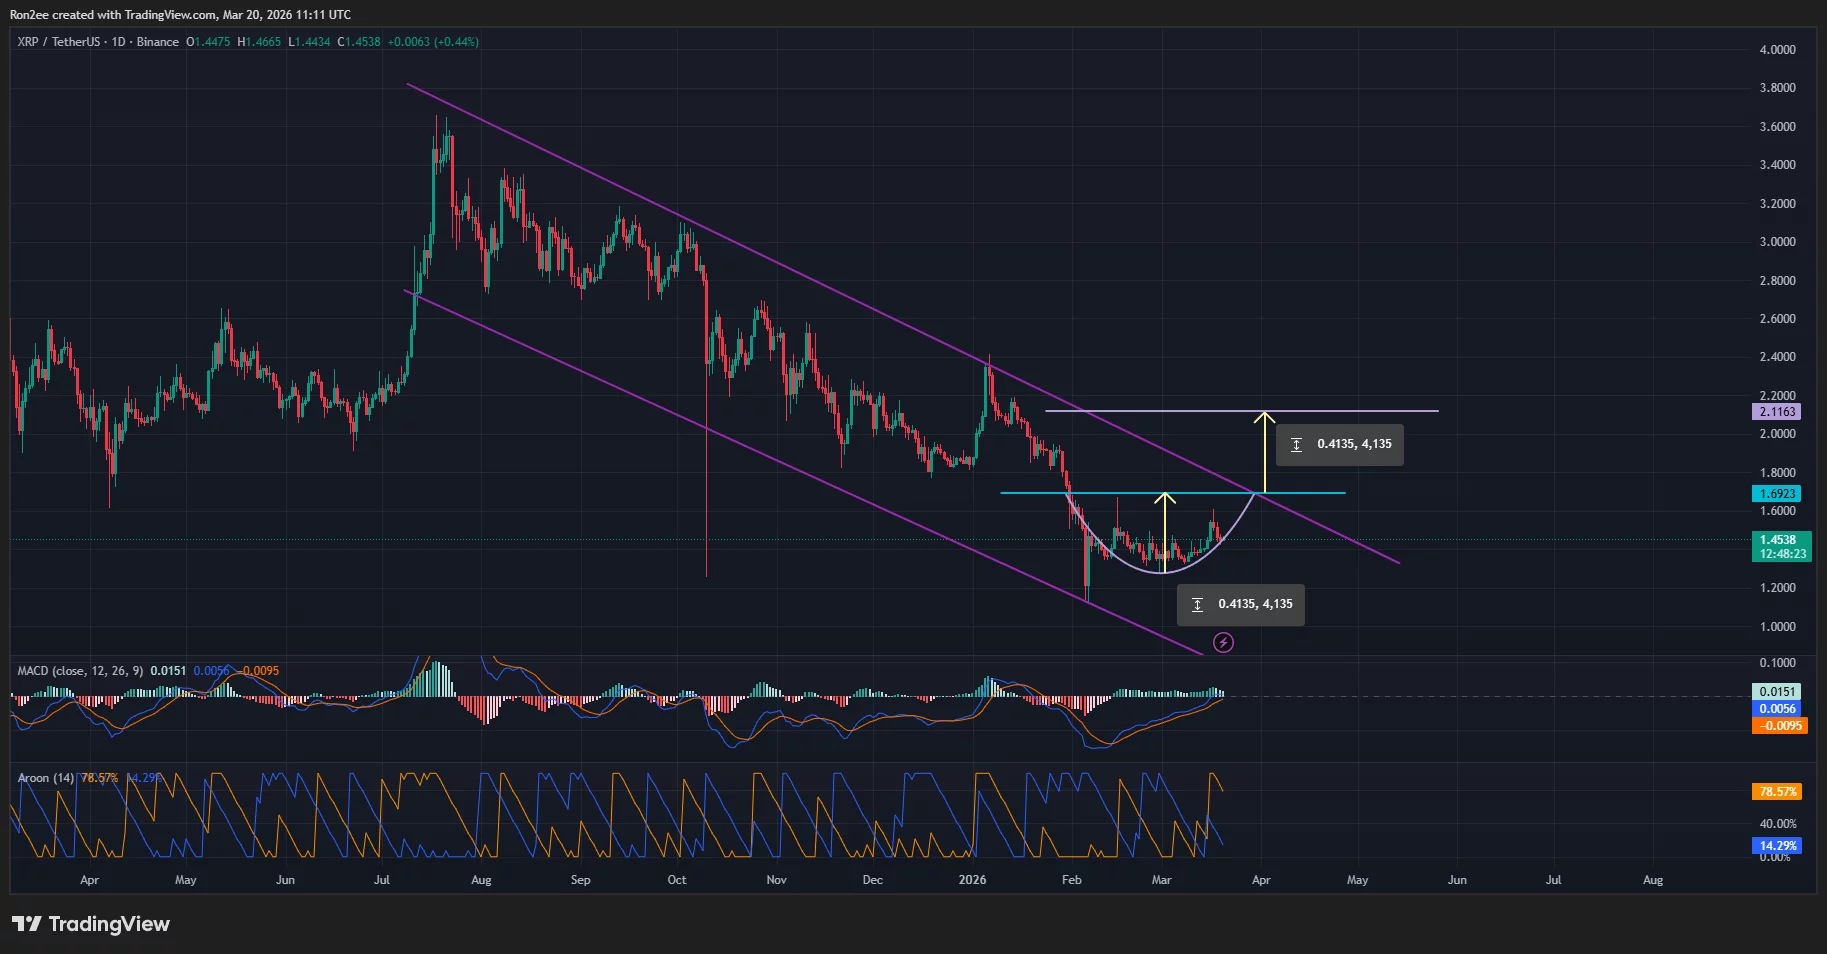 XRP price has formed multiple bullish patterns on the daily chart — March 20 | Source:
crypto.news
XRP price has formed multiple bullish patterns on the daily chart — March 20 | Source:
crypto.news
More recently, XRP price has also been forming a rounded bottom pattern, which has historically been followed by a gradual shift from bearish to bullish sentiment as buyers slowly regain control.
For now, the key resistance level to watch is $1.69, which serves as the neckline of the rounded bottom pattern. A move past this point would confirm both a breakout from the pattern and the descending channel at the same time.
A decisive break above this level could lift XRP up to $2.1, a target that has been calculated by adding the height of the rounded bottom to the point at which the breakout occurs.
Momentum indicators seem to present a strengthening case for the bulls. Notably, the MACD lines have pointed upwards while the Aroon Up at 78.57% sits far above the Aroon Down at 14.29%, also confirming that the upward trend is currently gaining significant steam.
Disclaimer: The content of this article solely reflects the author's opinion and does not represent the platform in any capacity. This article is not intended to serve as a reference for making investment decisions.
You may also like
NEWMARK GROUP INC <NMRK.O>: KBW CUTS TARGET PRICE TO $16 FROM $17.50
NEWMARK GROUP INC : KBW CUTS TARGET PRICE TO $16 FROM $17.50
VALERO ENERGY CORP <VLO.N>: JEFFERIES CUTS TARGET PRICE TO $394 FROM $401
VALERO ENERGY CORP : JEFFERIES CUTS TARGET PRICE TO $394 FROM $401
Gold prices rise Rs 1,500/10g; silver up Rs 3,100/kg ahead of US economic data, softer yields. Buy, sell or hold?
The Shopify Stock Rally Isn't Done: Chart of the Week -- Barrons.com
By Doug Busch Shopify is no longer a pandemic-era growth story that simply failed to slow down. It is compounding at a pace few software platforms its size still manage. In the second quarter of 2026, sales on its platform rose 32%. That was the fifth straight quarter of growth exceeding 30%. Merchants are also using more of Shopify's own tools, from payments to Shop Pay, and new channels like AI shopping agents are starting to increase demand. The simple bull case is that the stock already commands a huge share of independent online commerce, and that position should become more valuable as more buying moves through its checkout. A rule of market mechanics is that the vast majority of an individual security's gain is driven by its underlying sector. Within technology, software has staged a robust recovery, joining semiconductors to power the broader sector higher. The iShares Expanded Tech-Software Sector ETF has maintained an upward trajectory since its mid-April lows, though the advance from $74 to $112 has been choppy as bulls repeatedly stepped in to defend when necessary. Breadth across large-cap software has expanded significantly, with 24 constituents surging over 20% over the past three months. During that same three-month window, Shopify generated outstanding relative strength, advancing 36%, more than doubling the IGV's 17% gain over the same period. Expect the stock's outperformance to persist as software momentum broadens. Let's examine the daily and monthly charts to outline the technical drivers behind this thesis. Looking at the daily chart, the ratio chart against the IGV shows persistent outperformance extending back to mid-May. The stock is riding an eight-session winning streak, during which price action cleared a double-bottom-with-handle pivot at $151.39. Within this broader base, the stock recorded a bullish golden cross in late August and successfully filled its Sept. 10 price gap, tracing back to its Aug. 4 session, the day before a powerful earnings reaction sent the stock surging 17% hi
Crypto prices
More


