

Bitcoin trades at $70,853, up 1.34%, recovering from Thursday’s lows after Britain, France, Germany, Italy, the Netherlands, and Japan issued a joint statement condemning Iran’s attacks and announcing collaborative efforts to secure passage through the Strait of Hormuz. WTI crude fell nearly 2% to $93.80 on the news. Oil down means risk assets up, and BTC led the crypto recovery while ETH, XRP, and SOL posted smaller gains.
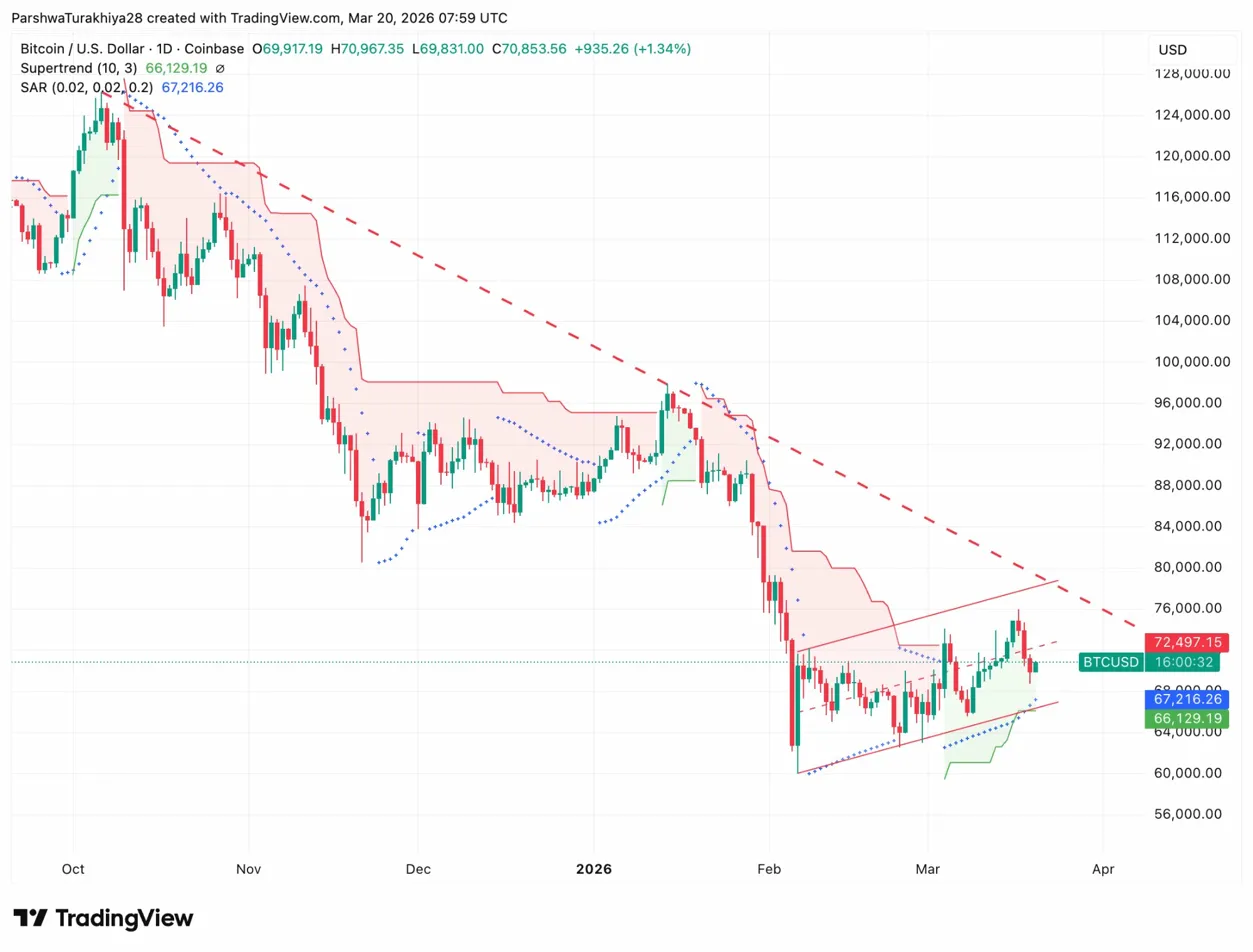 BTC Daily Price Action (Source: TradingView)
The daily chart shows BTC forming a symmetrical triangle from the February lows near $59,674 and the descending resistance from the October 2025 highs. The ascending trendline from the February lows currently sits near $67,000 to $68,000, while the descending resistance is falling through $76,000 to $78,000. The triangle is compressing toward a resolution point in early April.
The Supertrend is bullish at $66,129, and the SAR sits at $67,216 below price. Both are in a supportive position, but the descending resistance trendline continues to reject every push above $74,000 to $76,000. Price is inside the triangle and moving toward its apex. The direction of the break when it comes will define BTC’s trajectory through Q2.
Key levels:
- Supertrend support: $66,129
- SAR support: $67,216
- Triangle lower boundary: ~$68,000 rising
- Triangle upper boundary: ~$76,000 falling
- Key resistance: $74,000 to $76,000
ETF Outflows Continue As Institutional Positioning Resets
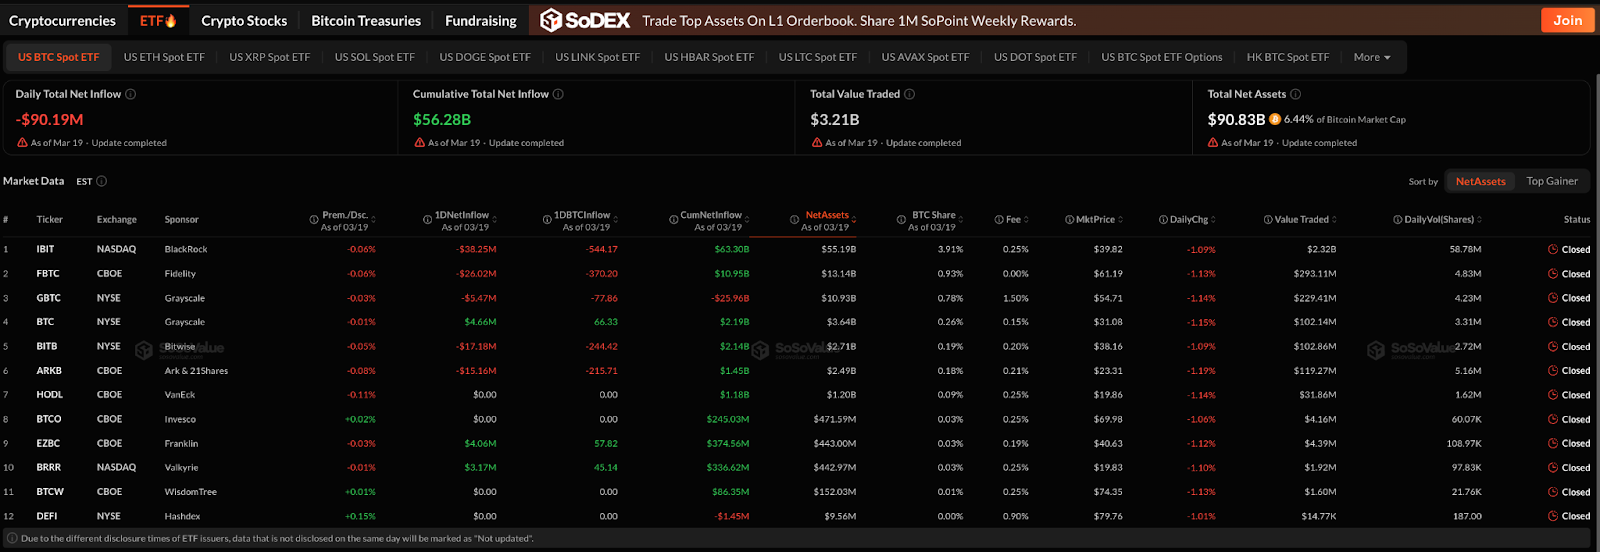 BTC ETF Flow Data (Source: SoSoValue)
$90.19M left Bitcoin spot ETFs on March 19. BlackRock’s IBIT led at $38.25M, with Fidelity FBTC at $26.02M, Ark ARKB at $15.16M, and Bitwise BITB at $17.18M. Combined with March 18’s $163.52M outflow, two days of redemptions total $253M. Cumulative net inflows still stand at $56.28B with $90.83B in total net assets.
Institutional holders positioned for a dovish Fed got the opposite. The deleveraging is happening through ETF redemptions rather than direct spot selling, which is orderly but not encouraging heading into the weekend.
Morgan Stanley’s second S-1 amendment confirmed the Morgan Stanley Bitcoin Trust will list on NYSE Arca under the ticker MSBT, with a basket size of 10,000 shares and a $1M seed basket. BNY Mellon handles cash custody and administration, Coinbase serves as prime broker.
Approval would make Morgan Stanley the first major US bank to directly sponsor a spot Bitcoin ETF. The bank’s own data shows 80% of current spot crypto ETF demand on its platform comes from self-directed investors rather than advisor-managed accounts. That distribution channel is largely untapped. The SEC’s recent guidance removing the non-securities classification barrier for most tokens removes the compliance objection that kept institutional desks sidelined.
- Bullish case: BTC holds the $68,000 triangle lower boundary, oil continues falling on Hormuz progress, and price breaks above $76,000. MSBT approval adds a new institutional demand channel. Targets above the triangle are $78,000 to $80,000.
- Bearish case: Hormuz tensions escalate again, S&P 500 weakness deepens, and BTC loses $68,000. The Supertrend at $66,129 is the last reference point before the February lows near $59,674.


