

-
Quant (QNT) price today trades near $78, up 3.2% daily and 19% weekly, showing strong bullish momentum
-
Robinhood listing, on-chain accumulation, and breakout structure suggest QNT could target $85–$90 next
Quant (QNT) price is extending its upward move, currently trading around $78 after a sharp 19% weekly surge. The rally reflects a steady shift in momentum, with buyers consistently stepping in on dips and pushing price toward a key resistance zone.
Unlike short-lived spikes, this move has developed through controlled price expansion, indicating that the market is building a stronger foundation rather than overheating. With QNT now approaching the $80 level, attention is turning toward a potential breakout.
Robinhood Listing Adds Fresh Momentum to QNT Rally
A key catalyst behind the recent upside is QNT’s listing on Robinhood, which has significantly expanded access to retail investors. The platform confirmed that QNT is now available for trading on Robinhood Crypto, including major markets like New York. This is a meaningful development, as Robinhood often acts as an entry point for new market participants.

Early wallet activity suggests initial inflows and accumulation, even if volumes remain modest for now. Historically, such listings tend to trigger:
- Increased visibility and accessibility
- Fresh retail-driven liquidity
- Short-term momentum acceleration
The timing is particularly notable, as the listing coincides with an already strengthening technical setup, amplifying the impact of the rally.
Quant Price Analysis: Will QNT Reach $100?
QNT price structure is showing a clear trend reversal. After months of trading under a descending trendline, price has now pushed higher and is attempting to break above this resistance. This marks the first meaningful shift away from the previous downtrend.
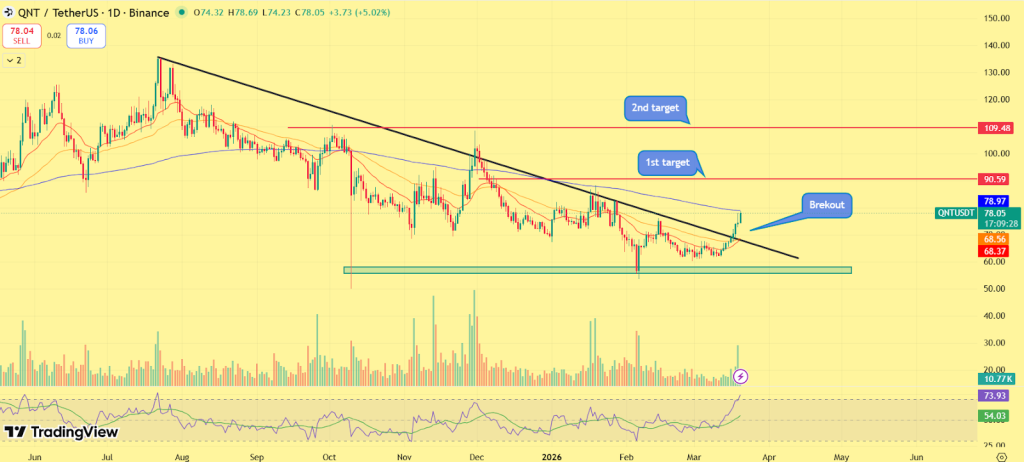
QNT/USDT price chart also highlights a strong demand zone near $55–$65, where repeated downside attempts were absorbed. This base has acted as a foundation for the current rally, reinforcing the idea of accumulation before expansion. Momentum is gradually strengthening, with indicators trending higher while still leaving room for further upside.
Key Levels to Watch
Immediate resistance: $88-90
Next target zone: $90–$100
Support: $68-$72
Demand zone: $60–$65
A confirmed breakout above $80 would validate the bullish structure and open the path toward the $90 region, which aligns with the next major supply zone. If rejected, price may retest the $70 level, but the broader structure would remain intact as long as higher lows continue to form.
On-Chain Data Points to Accumulation Phase
Supporting the rally, on-chain signals indicate that QNT is currently in an accumulation phase rather than distribution. Exchange balances have shown signs of decline, suggesting that tokens are being moved off exchanges and into long-term holding. At the same time, trading volume has increased alongside price, pointing to real demand rather than thin market conditions.
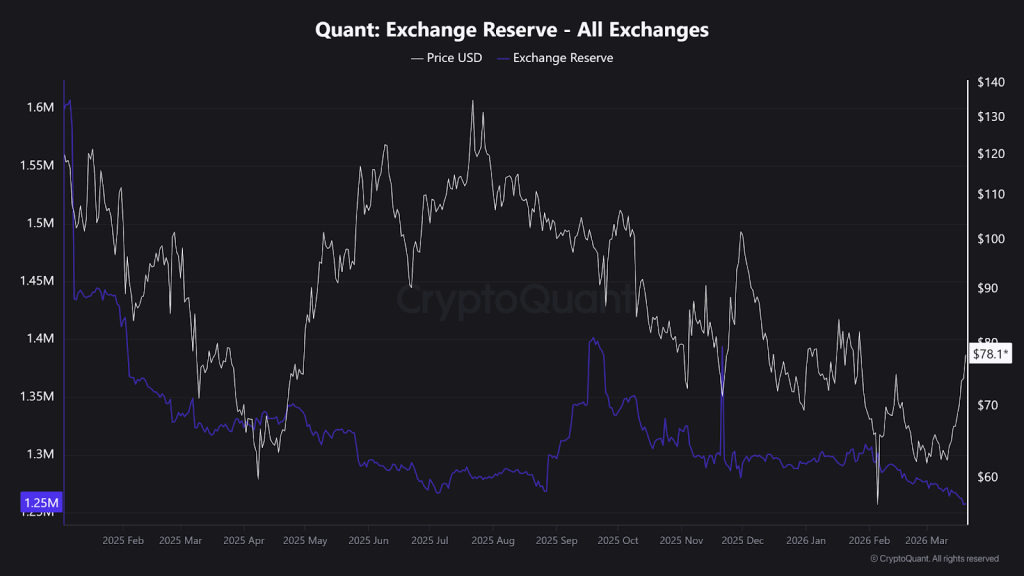
Derivatives activity is also picking up, reflecting growing participation and positioning among traders. This combination of tightening supply and rising demand typically creates favorable conditions for continued upside, especially when aligned with strong technical structure.
Final Outlook: Momentum, Structure, and Narrative Begin to Align
The current setup is being driven by a convergence of key factors. The Robinhood listing has improved accessibility, on-chain data points to accumulation, and the technical structure is shifting from downtrend to potential reversal. This alignment across fundamentals, sentiment, and price action increases the probability of a sustained move.
Historically, such conditions often precede strong directional expansions, as multiple layers of the market begin positioning in the same direction. With strong weekly gains, improving demand, and a breakout attempt underway, QNT is positioning itself as one of the more structurally bullish altcoins in the current market phase.


