

 cryptoticker.io
As of March 19, 2026, the global financial markets are witnessing a rare and counter-intuitive phenomenon. Despite an escalation in the Middle East conflict—including strikes on critical energy infrastructure—both Gold (XAU/USD) and Bitcoin ($BTC/USD) are trading in the red. Traditionally, these assets serve as the world’s primary "disaster hedges," yet they have both succumbed to a broader market sell-off following the Federal Reserve’s hawkish stance on Wednesday.
This "double drop" is not a sign that the safe-haven narrative is dead. Instead, it is a textbook example of a liquidity squeeze driven by a resurgent US Dollar and rising bond yields. As oil prices surge above $110 per barrel, the market is pricing in "sticky" inflation, forcing the Fed to keep interest rates high, which historically creates a temporary headwind for non-yielding assets like Gold and high-beta assets like Bitcoin.
Why are Gold and Bitcoin Falling Today?
The primary reason Gold and Bitcoin are dropping today is the Federal Reserve’s decision to hold interest rates at 3.5%–3.75% while signaling fewer rate cuts for the remainder of 2026. This move strengthened the US Dollar Index (DXY), making dollar-denominated assets more expensive. Furthermore, investors are selling "winning" positions in Gold and Bitcoin to cover margin calls in the plummeting equity and energy markets.
Gold Price Analysis: XAU/USD Rejects the $5,000 Milestone
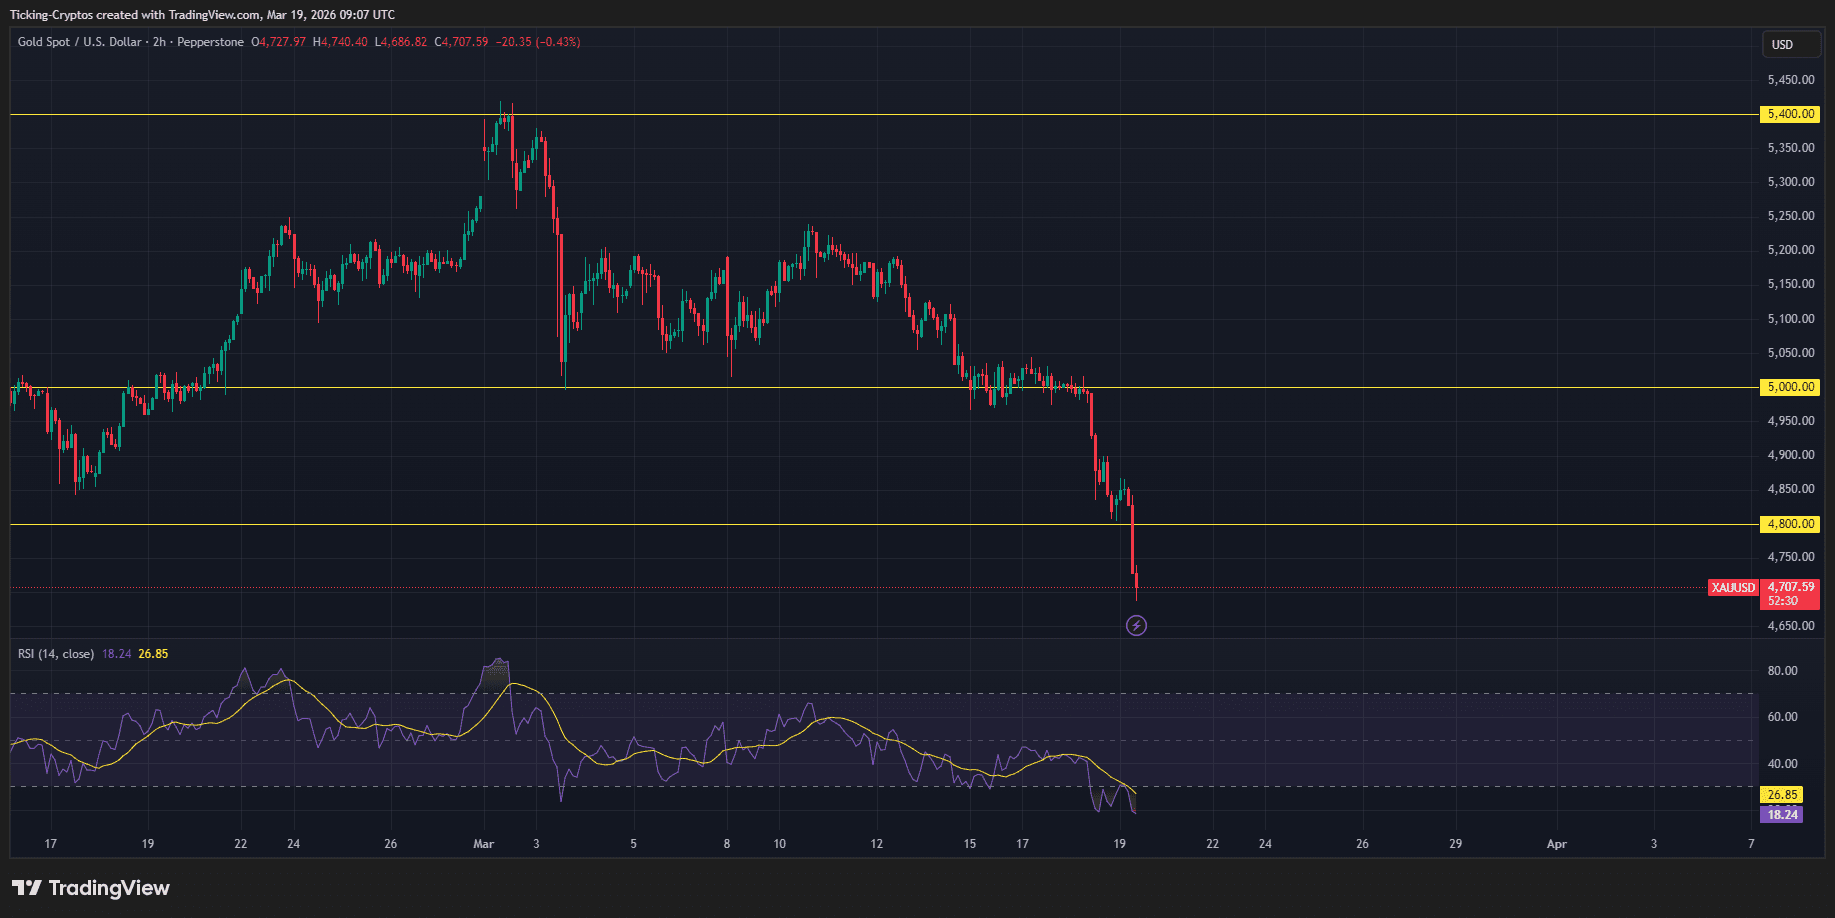
After flirting with the psychological resistance of $5,000 earlier this week, Gold has entered a sharp corrective phase. On the morning of March 19, spot gold slipped toward the $4,800 region, marking its most significant losing streak in over a year.
Critical Support and Resistance Levels
- Major Support: $4,840 – $4,750. This zone represents a historical "buy-the-dip" area for central banks.
- Major Resistance: $5,000. Reclaiming this level is essential for the bullish trend to resume.
The "Oil Shock" of 2026 has been a double-edged sword for Gold. While it fuels long-term inflation (bullish for Gold), it also increases the likelihood of a "higher-for-longer" interest rate environment (bearish for Gold). Currently, the market is prioritizing the interest rate risk over the inflation hedge.
Bitcoin Technical Analysis: Is $70,000 the New Floor?
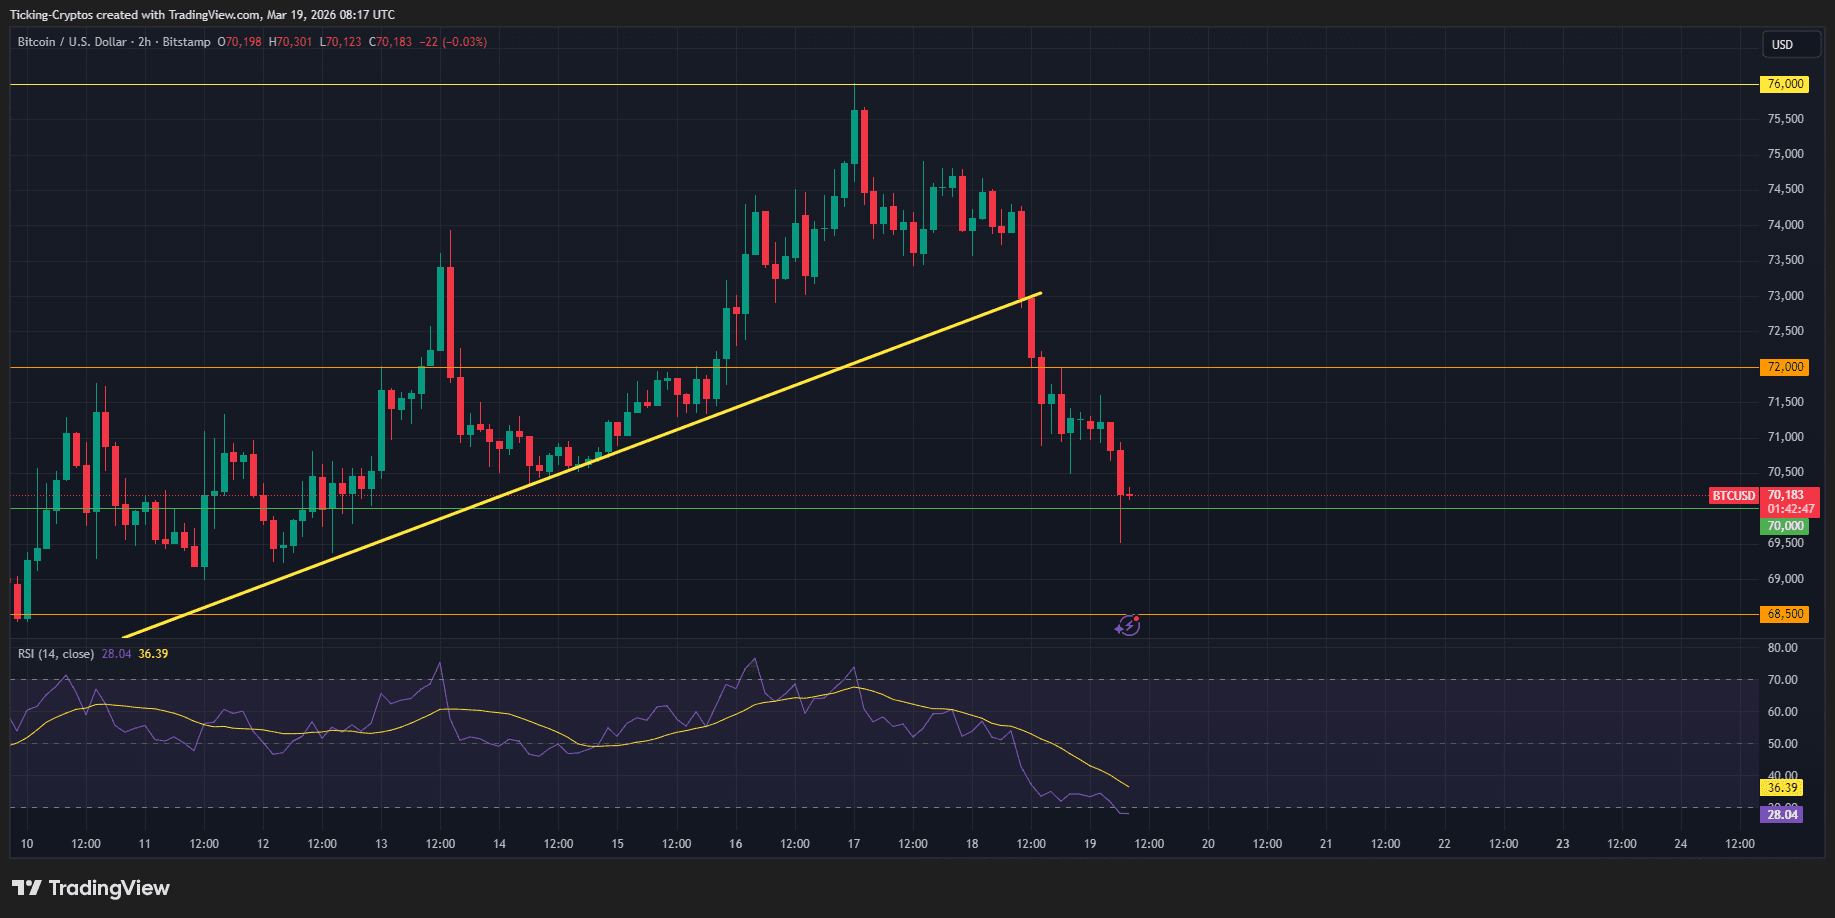
Bitcoin has shown relative resilience compared to the broader "Risk-On" sector, yet it was unable to sustain its push toward $76,000. On Thursday, $BTC dropped below $71,000, tracking the general weakness in global liquidity.
The "Digital Gold" Decoupling
Interestingly, the 2026 correlation between Gold and Bitcoin has shifted. According to recent data from Investing.com, Bitcoin is increasingly behaving as a "Global Liquidity Sponge." It thrives when money is cheap. With the Fed’s hawkish tone, Bitcoin is facing a temporary outflow. However, institutional demand via Bitcoin ETFs remains a structural floor that prevented a crash below $66,000.
- $BTC Immediate Support: $70,200.
- $BTC Resistance: $74,500.
The 2026 Correlation: Safe Havens vs. Liquidity Hedges
Traders often mistake Bitcoin and Gold for the same type of asset. In 2026, the distinction has become clear:
- Gold: A geopolitical "bunker" asset. It drops when the Dollar is strong but rises when sovereign trust fails.
- Bitcoin: A "technological" hedge. It performs best when the financial system seeks an alternative rail for 24/7 global liquidity.
| Gold (XAU) | Bearish | Fed Hawkishness / DXY Strength | Bullish (Target $5,500) |
| Bitcoin ($BTC) | Neutral-Bearish | Liquidity Withdrawal / ETF Flows | Highly Bullish (Target $100k+) |
How to Navigate the Bitcoin and Gold Crash
For investors looking to capitalize on this volatility, diversification remains the key. While the short-term trend is downward, the macro fundamentals—high debt, war, and energy shortages—historically favor both assets.
- For Gold: Look for stability around the $4,800 mark.
- For Bitcoin: Utilize the best crypto exchanges to set limit orders near $68,500, which has acted as a strong institutional accumulation zone.
- Security: Ensure your assets are safe by using a hardware wallet during these high-volatility periods.
Bitcoin Future: The Path Ahead for March 2026
The "Great Decoupling" of 2026 is in full swing. Gold is fighting the weight of a high-interest-rate environment, while Bitcoin is consolidating its gains after a massive Q1 rally. Despite the current price drops, the geopolitical unrest in the Middle East suggests that the "safe haven" trade is merely resting, not retreating. Traders should keep a close eye on the US Dollar Index (DXY); a reversal there will likely trigger a massive "relief rally" for both XAU and $BTC.


