

 cryptoticker.io
Bitcoin Price Crash: Crypto Market Faces a Sudden Reversal
The cryptocurrency market has entered a period of intense volatility today, March 18, 2026, with Bitcoin ($BTC) tumbling from its recent highs near $76,000 to the $72,000 range. This sudden "sea of red" has caught many retail traders off guard, especially following the bullish momentum seen earlier this week.
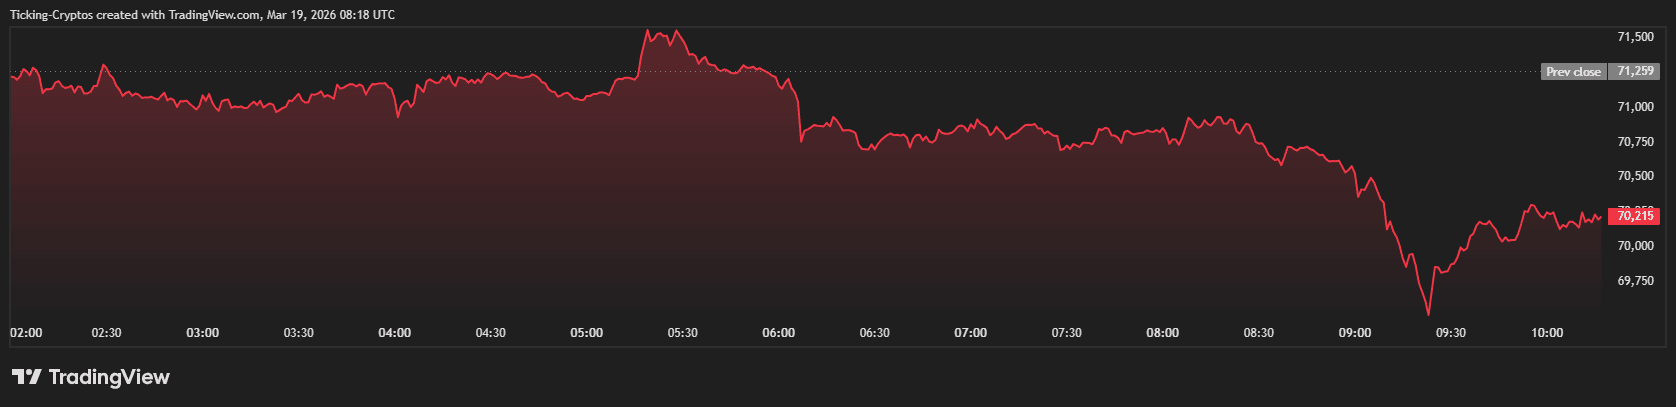
While the digital asset space often moves independently, today’s crash is a direct result of a "perfect storm" involving geopolitical escalations, disappointing US inflation data, and a necessary technical cooling period.
1. Middle East Escalation: Energy Infrastructure Under Attack
The primary driver of the "risk-off" sentiment across global markets is the dramatic escalation in the Middle East. Following Israeli strikes on Iran’s South Pars gas field—the world’s largest natural gas reserve—Tehran has officially declared its intent to retaliate against Gulf energy sites.
Key Geopolitical Developments:
- Target List: Iran’s Revolutionary Guards have identified key infrastructure in Saudi Arabia, the UAE, and Qatar as potential targets.
- Energy Disruption: Iraq has already reported a total halt of gas supplies from Iran, leading to a loss of approximately 3,100 megawatts of power.
- Oil Prices Surge: Brent crude has spiked toward $110 a barrel, fueling fears of global stagflation.
In times of war and energy insecurity, investors typically flee "risk assets" like cryptocurrencies in favor of "safe havens" like gold or the US Dollar. This flight to safety is putting massive downward pressure on the $Bitcoin price.
2. US Core PPI Hits 3.9%: Inflation Remains "Sticky"
Macroeconomic data released today has further dampened hopes for a dovish pivot from the Federal Reserve. The US Core Producer Price Index (PPI), which excludes volatile food and energy costs, came in at 3.9% year-over-year.
This figure significantly overshot market expectations of 3.7%. For crypto investors, this is a bearish signal because:
- Higher for Longer: Hotter-than-expected wholesale inflation suggests the Fed will keep interest rates elevated to cool the economy.
- Yield Pressure: Treasury yields have climbed following the report, making non-yielding assets like Bitcoin less attractive to institutional players.
- Liquidity Crunch: High interest rates reduce the "cheap money" that typically flows into speculative markets.
3. Technical Adjustment: The $76,000 Rejection
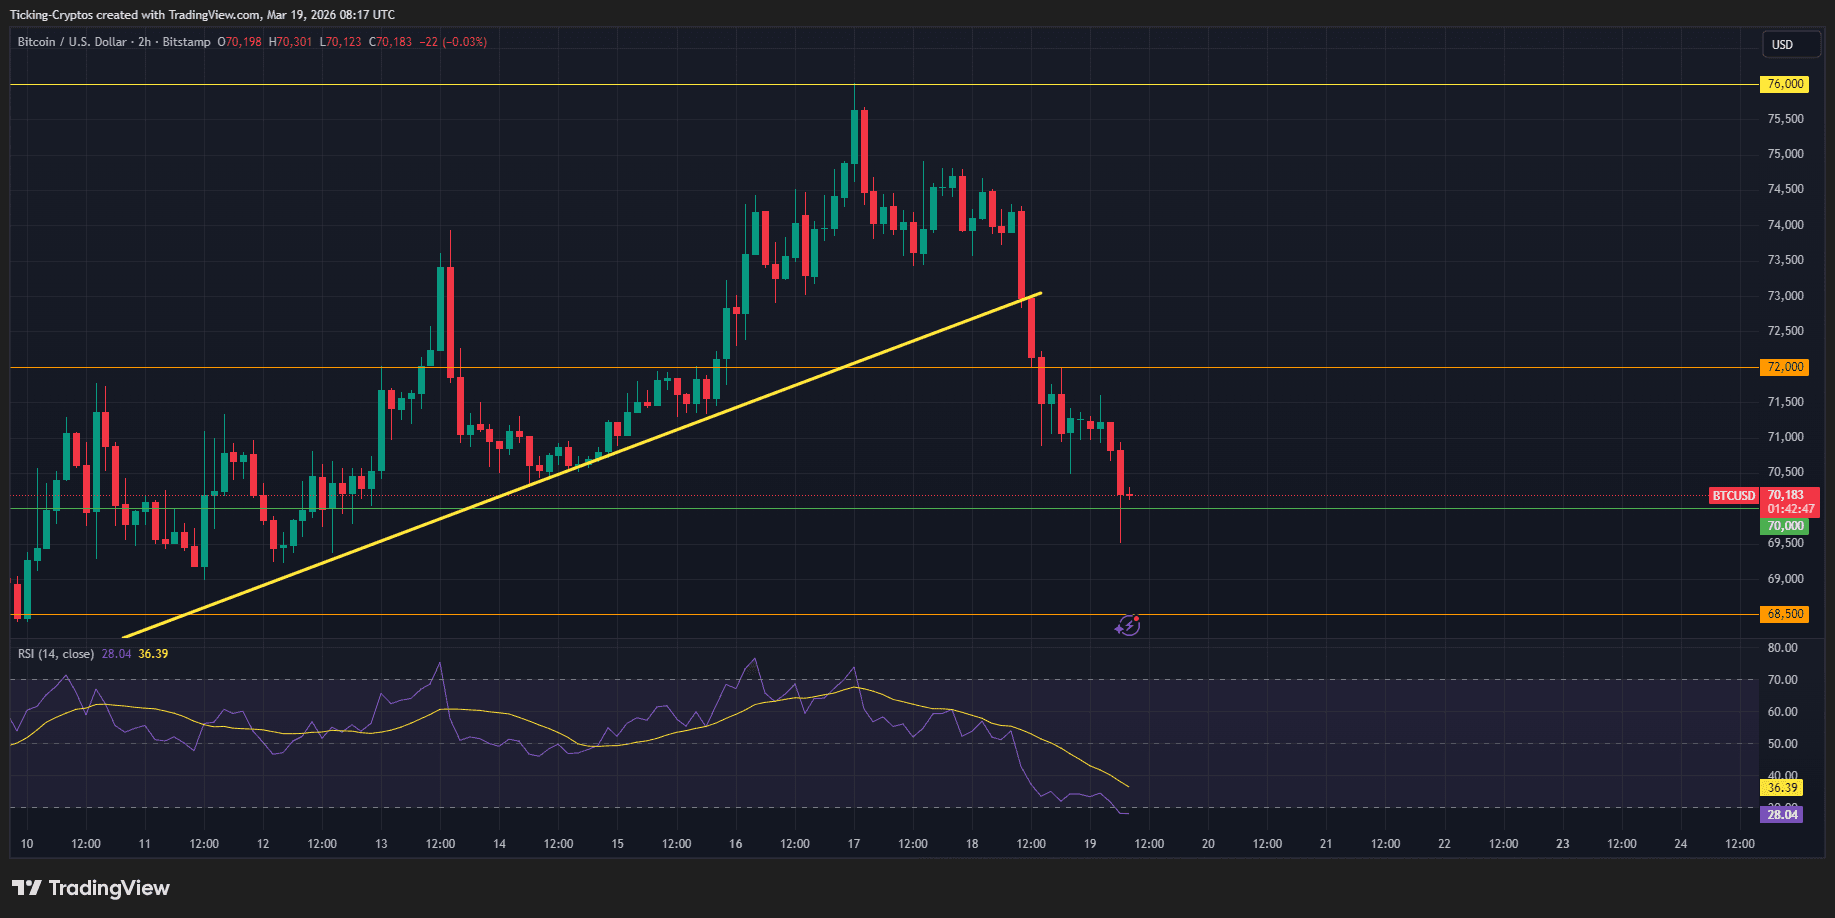
From a purely technical perspective, many analysts argue that a correction was overdue. Bitcoin recently hit a peak of $76,000, a level that acted as a psychological and technical glass ceiling.
The "Overheated" Market
Leading up to today’s drop, several on-chain indicators suggested the market was "overextended." Funding rates in the derivatives market had reached unsustainable levels, meaning long-positioned traders were paying high premiums to keep their bets open.
When the news of the Iranian retaliation broke, it triggered a "long squeeze," forcing leveraged traders to liquidate their positions. This mechanical selling accelerated the drop, pushing $BTC toward its immediate support levels.
What’s Next for Bitcoin and Altcoins?
The market is currently looking for a floor. While the $72,000 level is providing some initial support, the upcoming Federal Reserve meeting will be the next major catalyst. If the Fed adopts a hawkish tone due to the PPI data and rising energy costs, we could see further testing of the $68,000–$70,000 zone.


